Gene: SLMO2P1
chr1: 220641295-220642150Expression Profile
(log scale)
Graphical Connections
Distribution of linked clusters:
You may find it interesting if many of the connected DHS sites belong to the same cluster.| Cluster Profile | Cluster ID | Number of DHS sites in this cluster |
|---|---|---|
 | 568 | 5 |
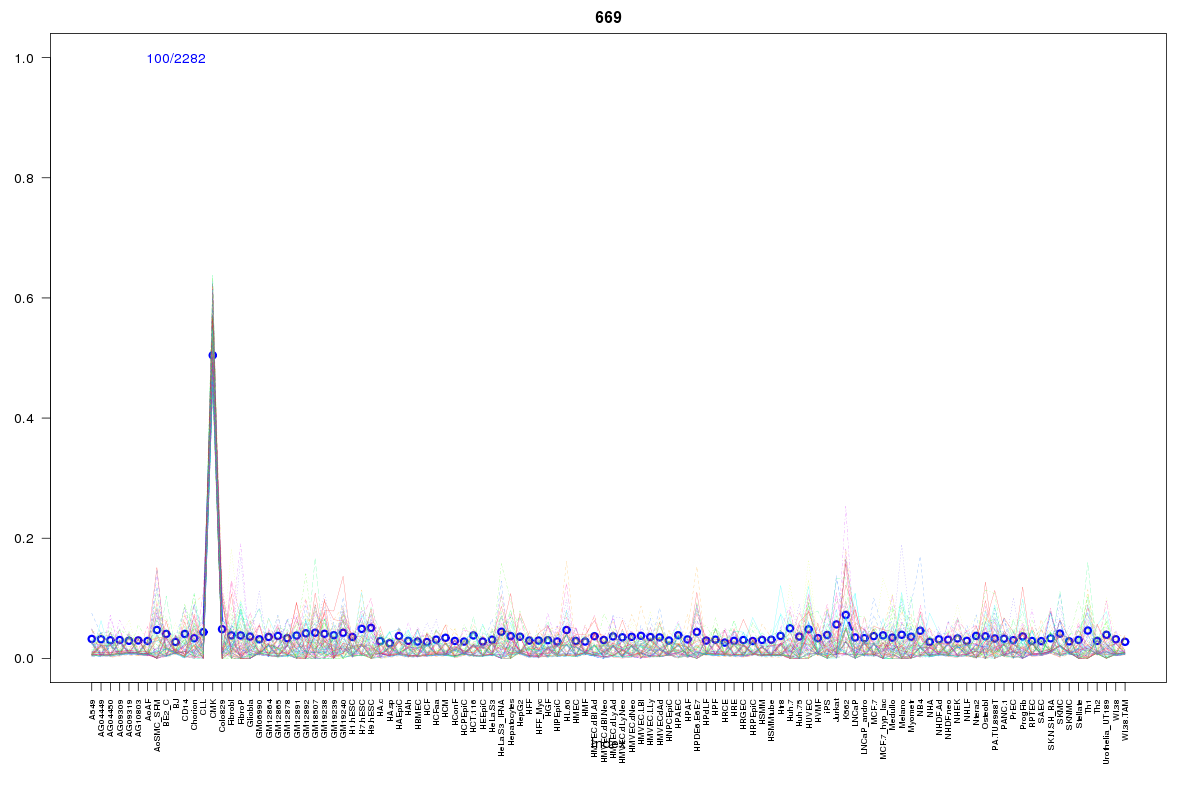 | 669 | 2 |
 | 10 | 1 |
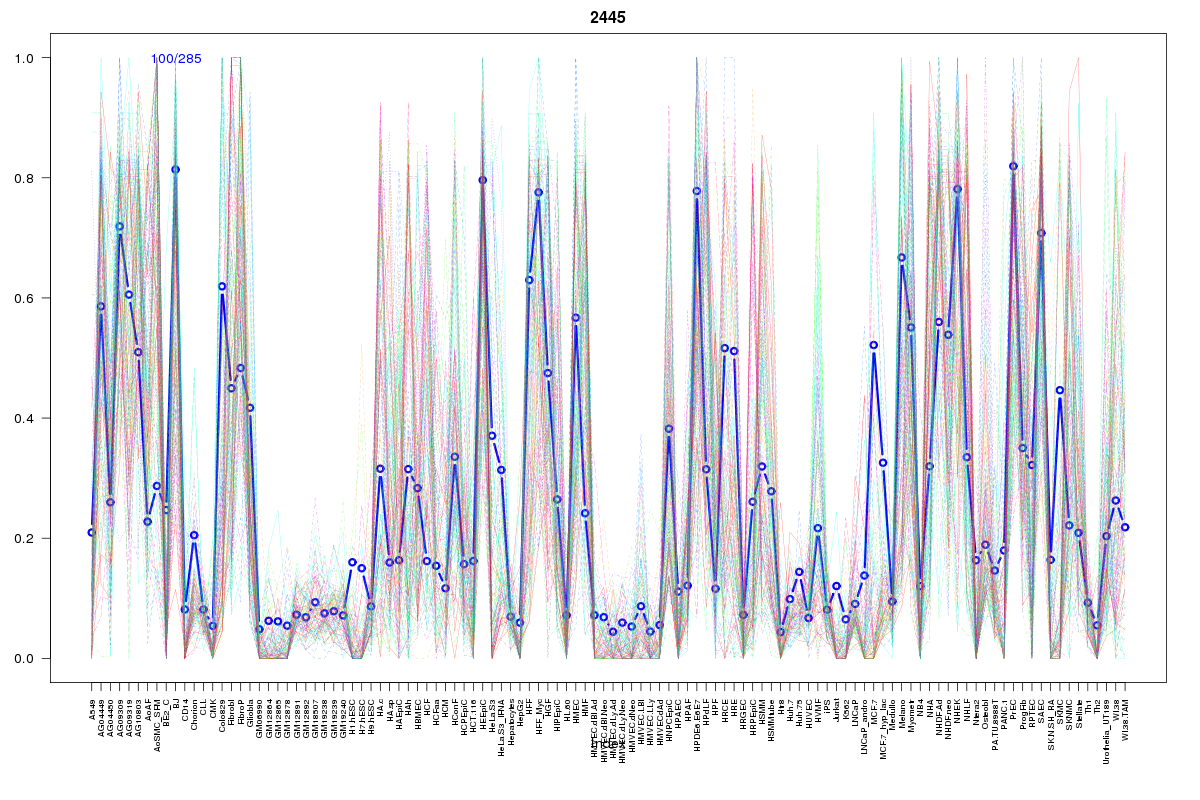 | 2445 | 1 |
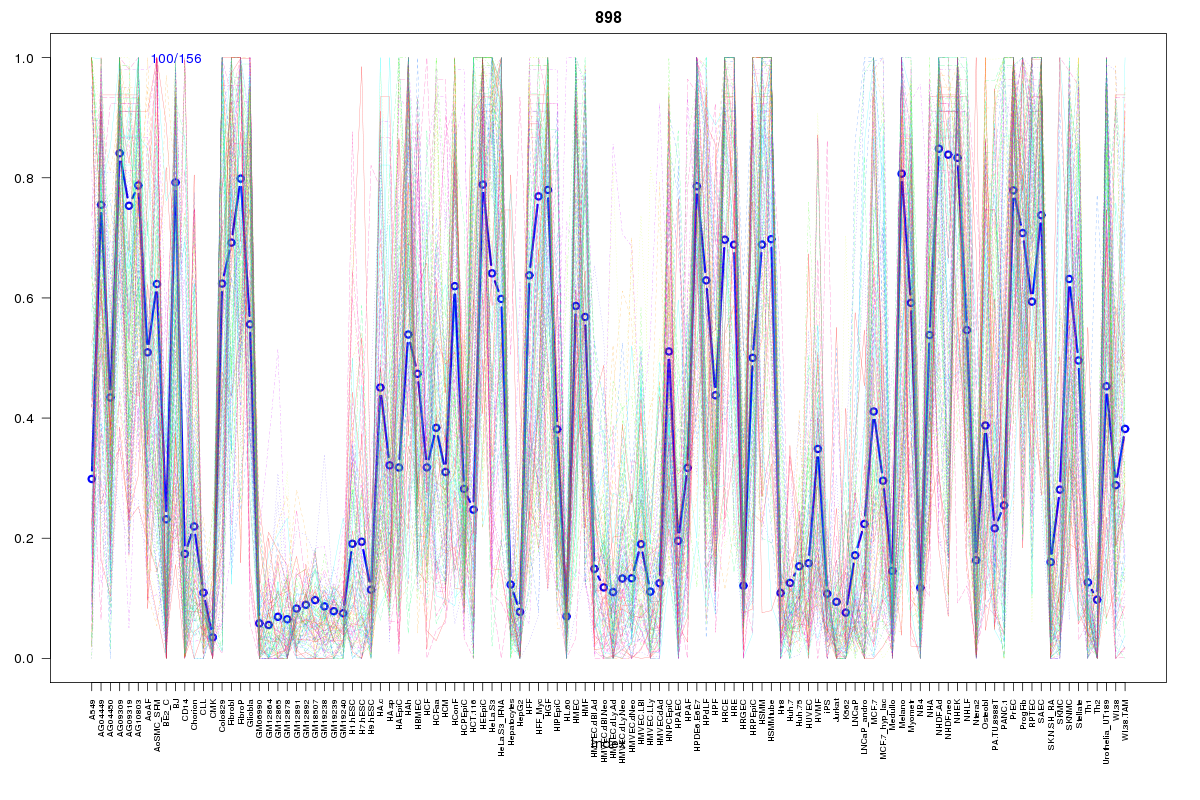 | 898 | 1 |
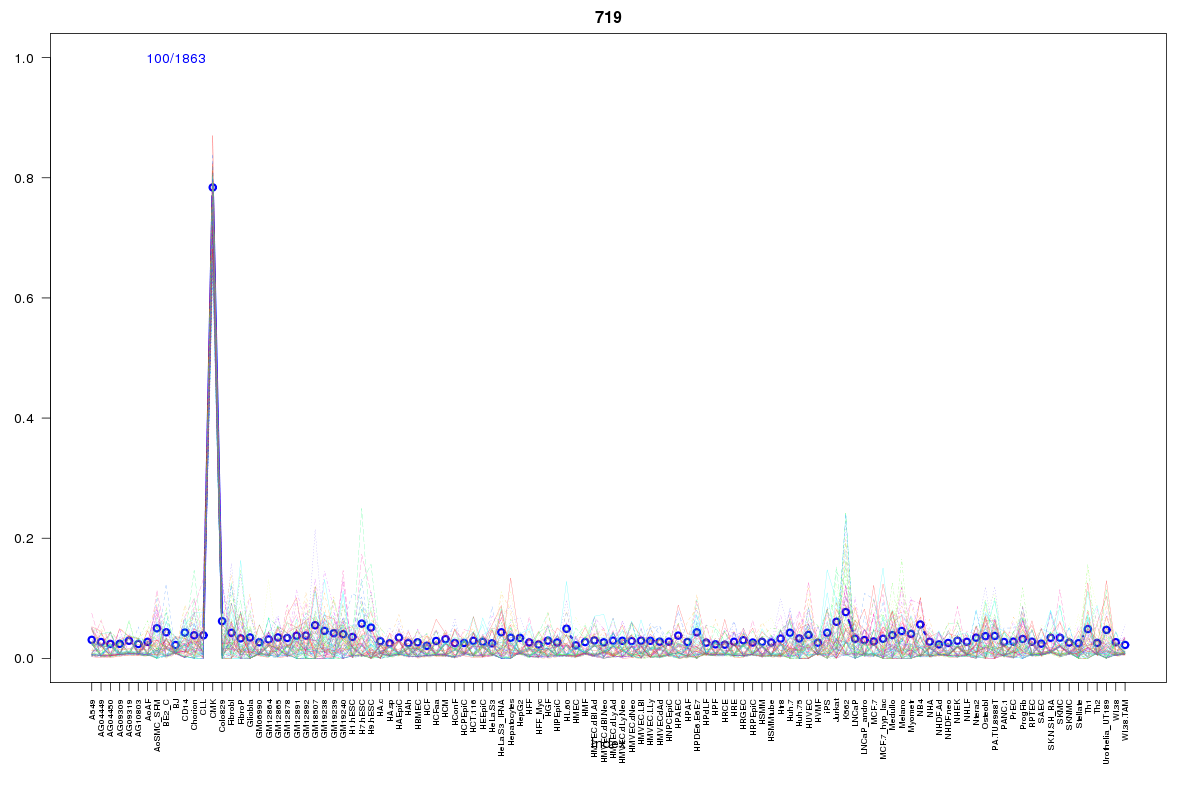 | 719 | 1 |
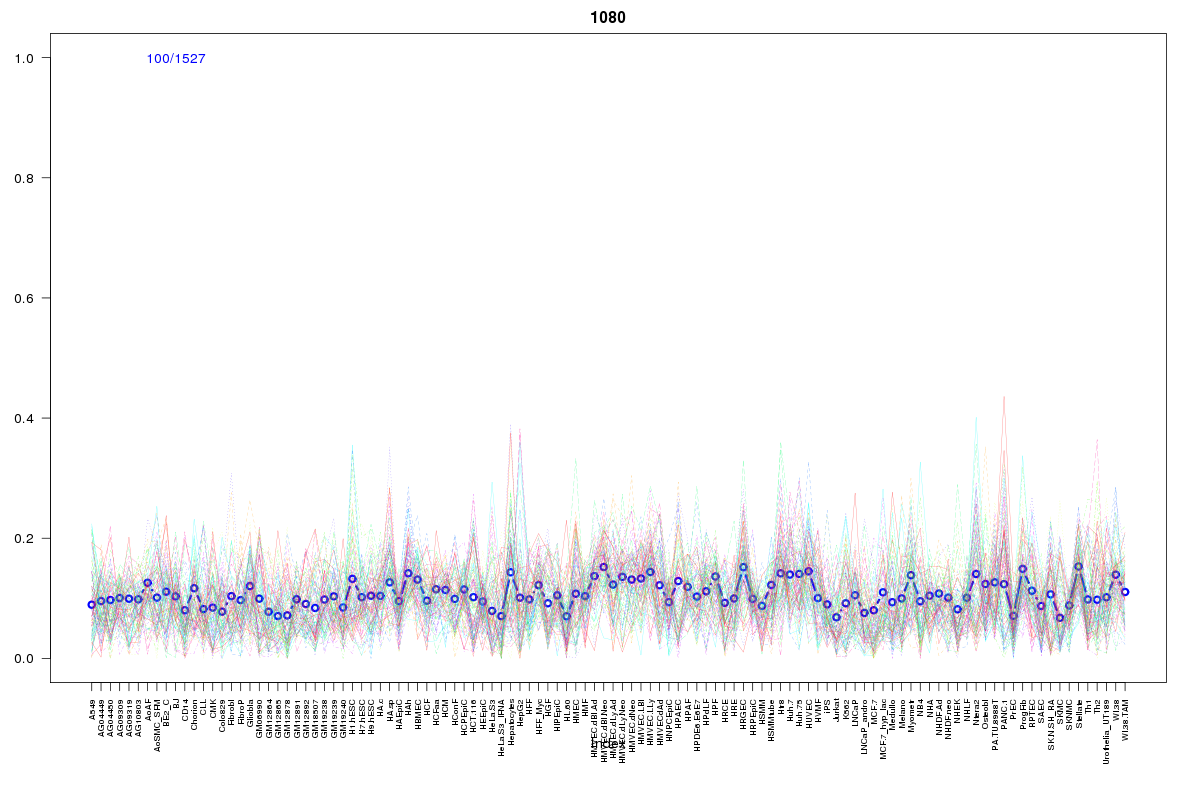 | 1080 | 1 |
Resources
BED file downloads
Connects to 12 DHS sitesTop 10 Correlated DHS Sites
p-values indiciate significant higher or lower correlation| Location | Cluster | P-value |
|---|---|---|
| chr1:220618000-220618150 | 719 | 0 |
| chr1:220617800-220617950 | 568 | 0 |
| chr1:220631440-220631590 | 669 | 0.002 |
| chr1:220632100-220632250 | 568 | 0.003 |
| chr1:220578240-220578390 | 568 | 0.003 |
| chr1:220631740-220631890 | 568 | 0.003 |
| chr1:220604060-220604210 | 568 | 0.004 |
| chr1:220614700-220614850 | 669 | 0.009 |
| chr1:220715805-220715955 | 10 | 0.016 |
| chr1:220700985-220701135 | 1080 | 0.024 |
| chr1:220543560-220543710 | 2445 | 0.016 |
External Databases
UCSCEnsembl (ENSG00000226226)