Gene: MTAPP2
chr3: 189686818-189687650Expression Profile
(log scale)
Graphical Connections
Distribution of linked clusters:
You may find it interesting if many of the connected DHS sites belong to the same cluster.| Cluster Profile | Cluster ID | Number of DHS sites in this cluster |
|---|---|---|
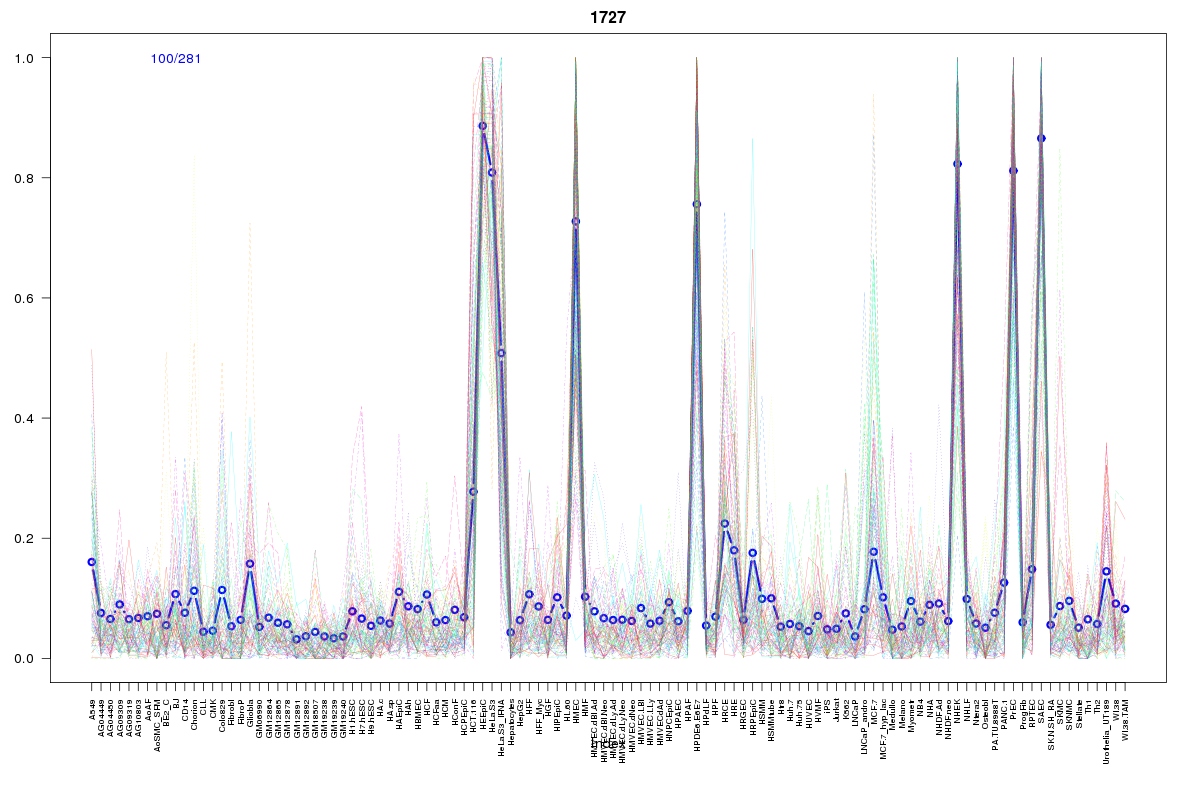 | 1727 | 1 |
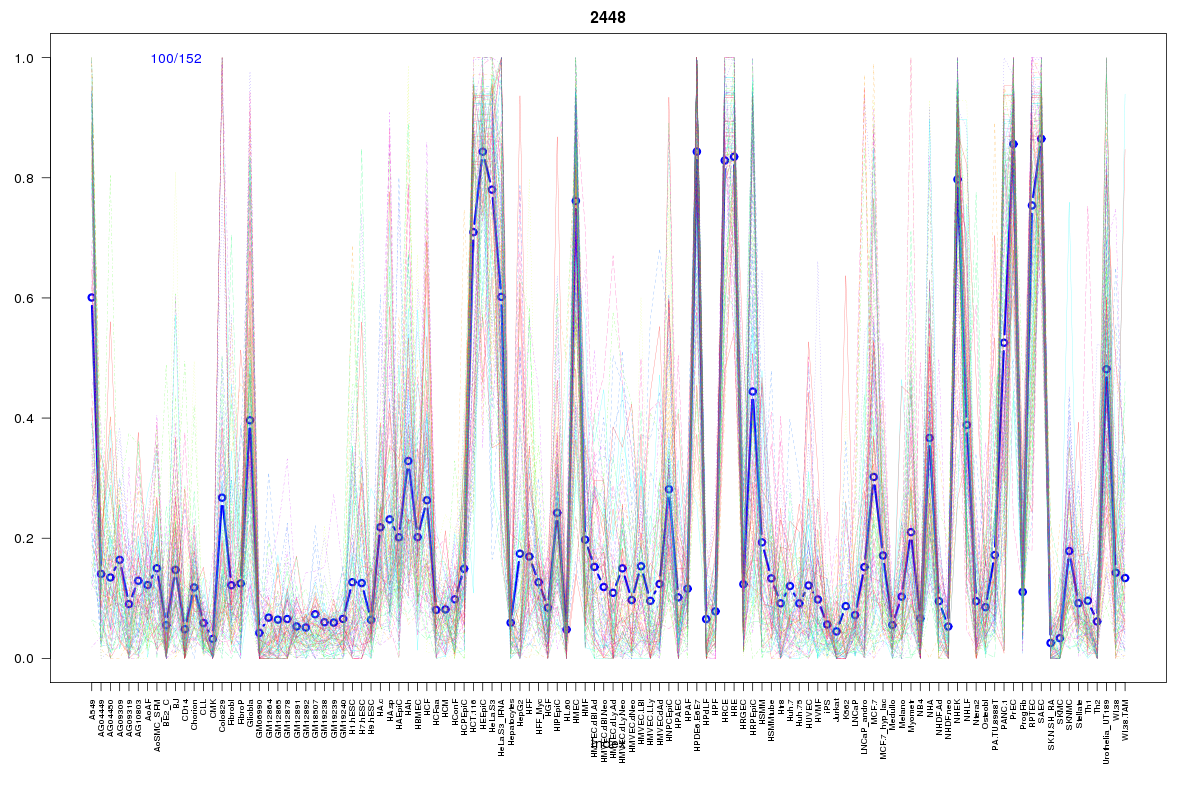 | 2448 | 1 |
 | 2175 | 1 |
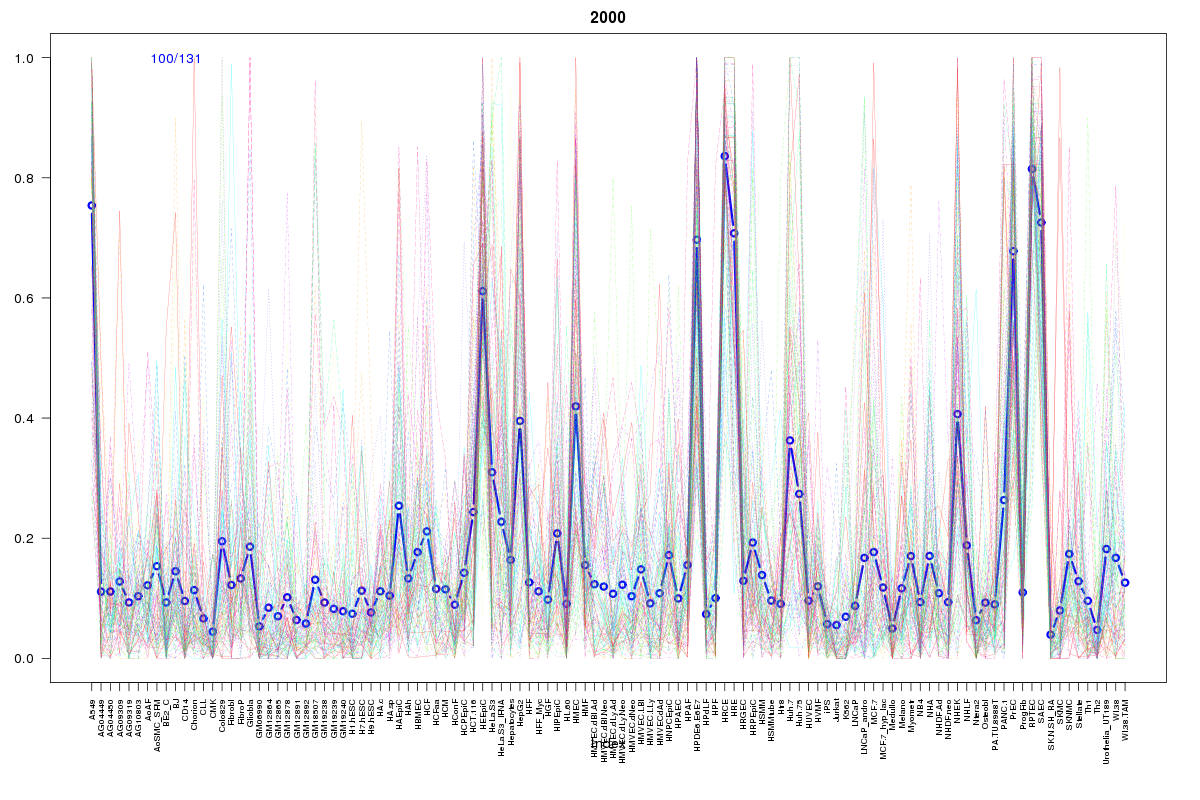 | 2000 | 1 |
 | 2262 | 1 |
 | 935 | 1 |
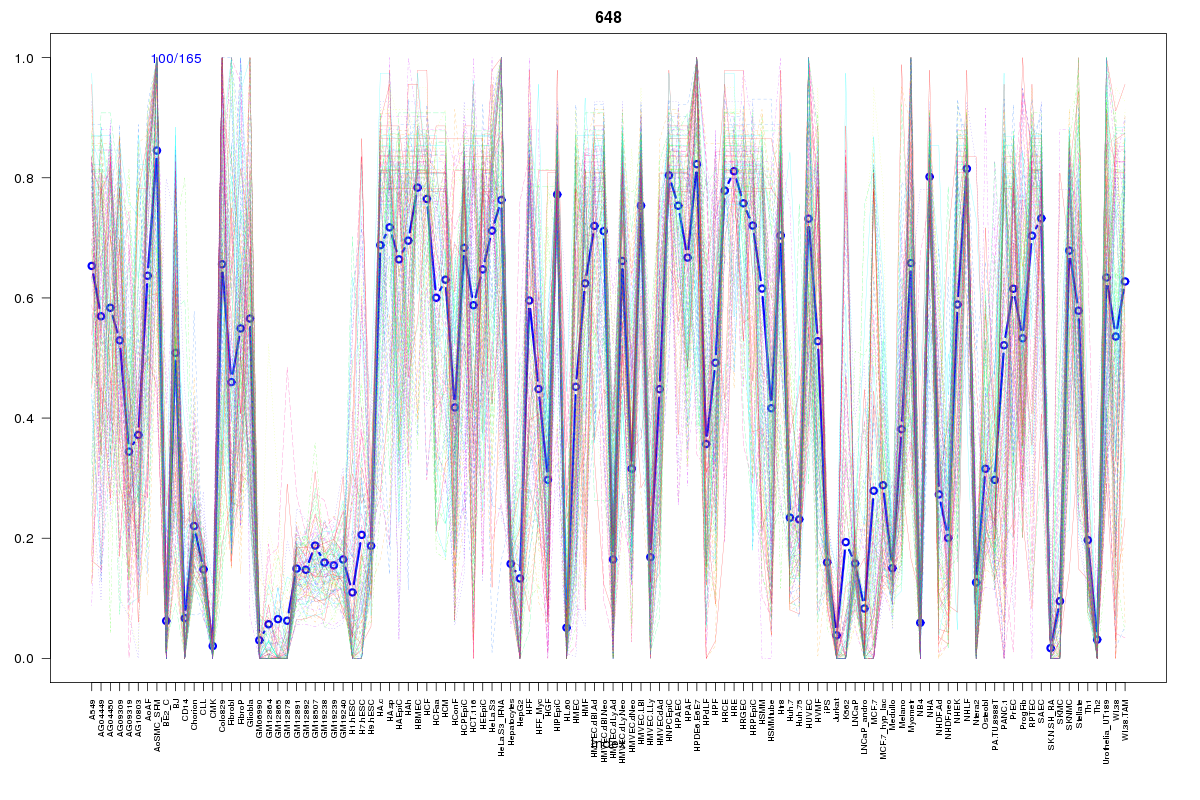 | 648 | 1 |
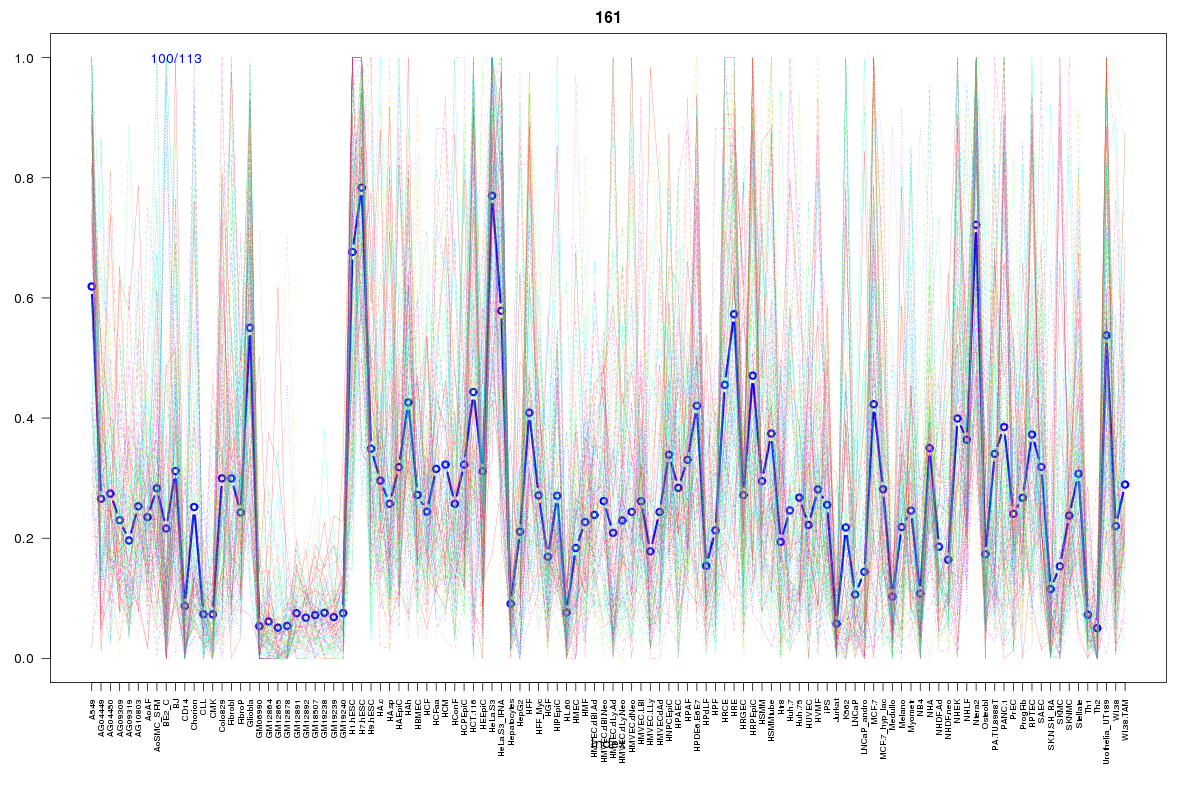 | 161 | 1 |
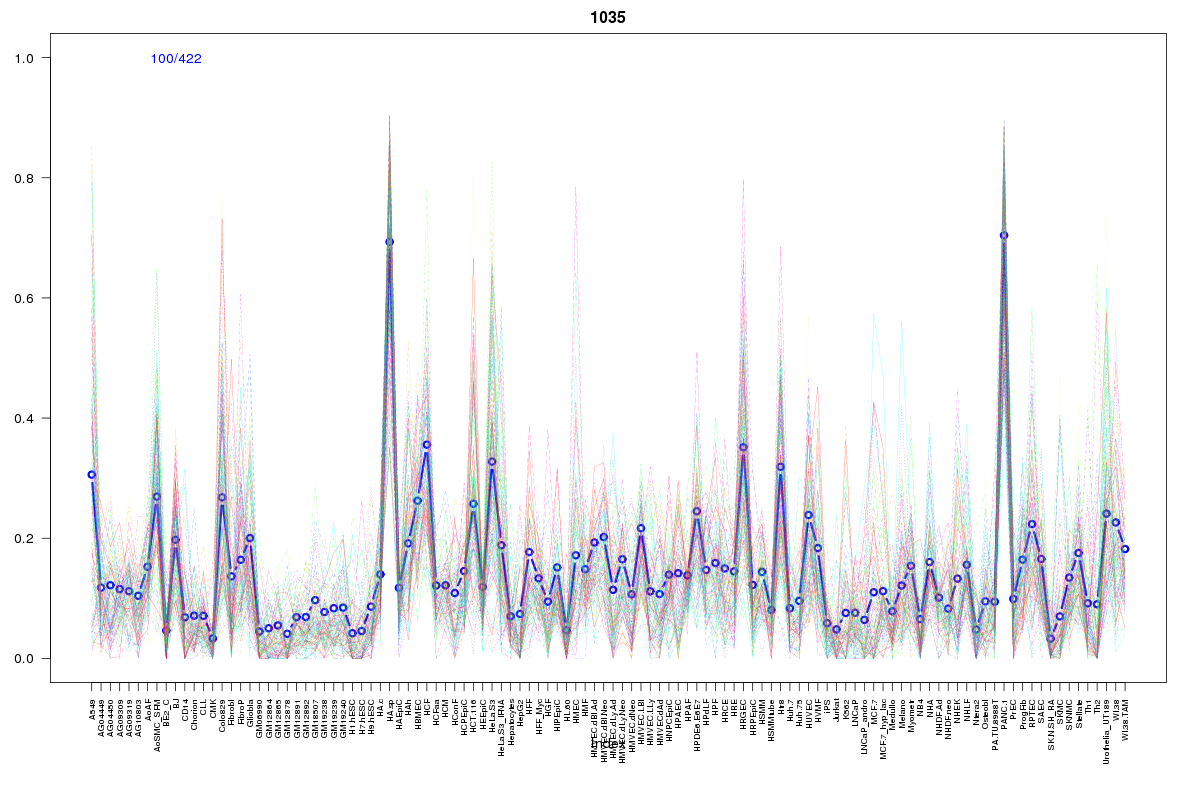 | 1035 | 1 |
 | 2133 | 1 |
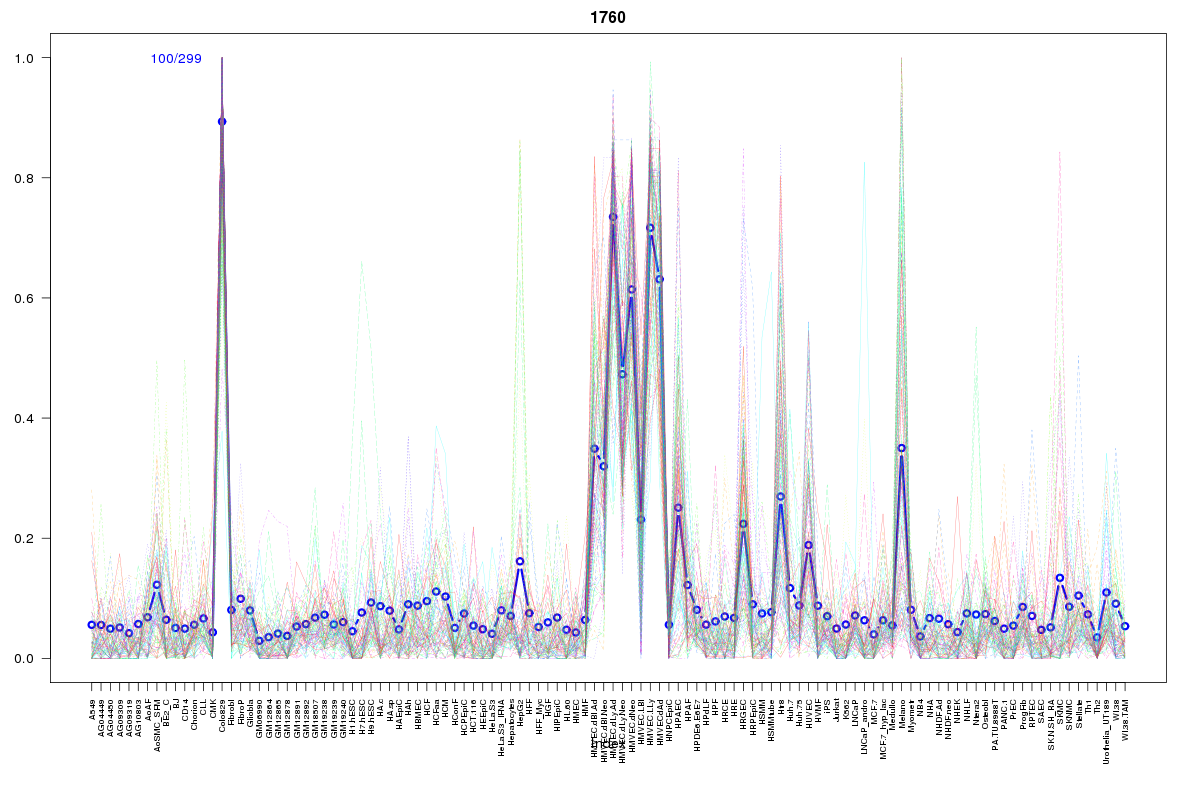 | 1760 | 1 |
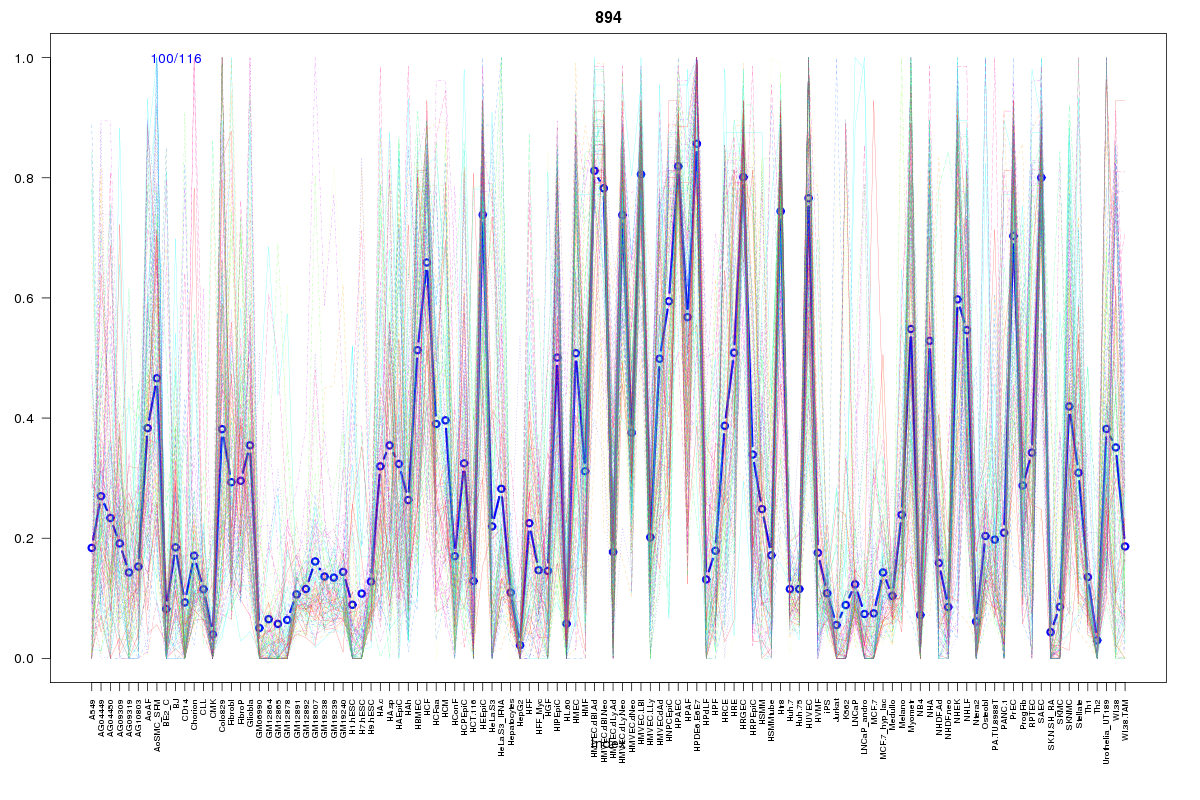 | 894 | 1 |
 | 2298 | 1 |
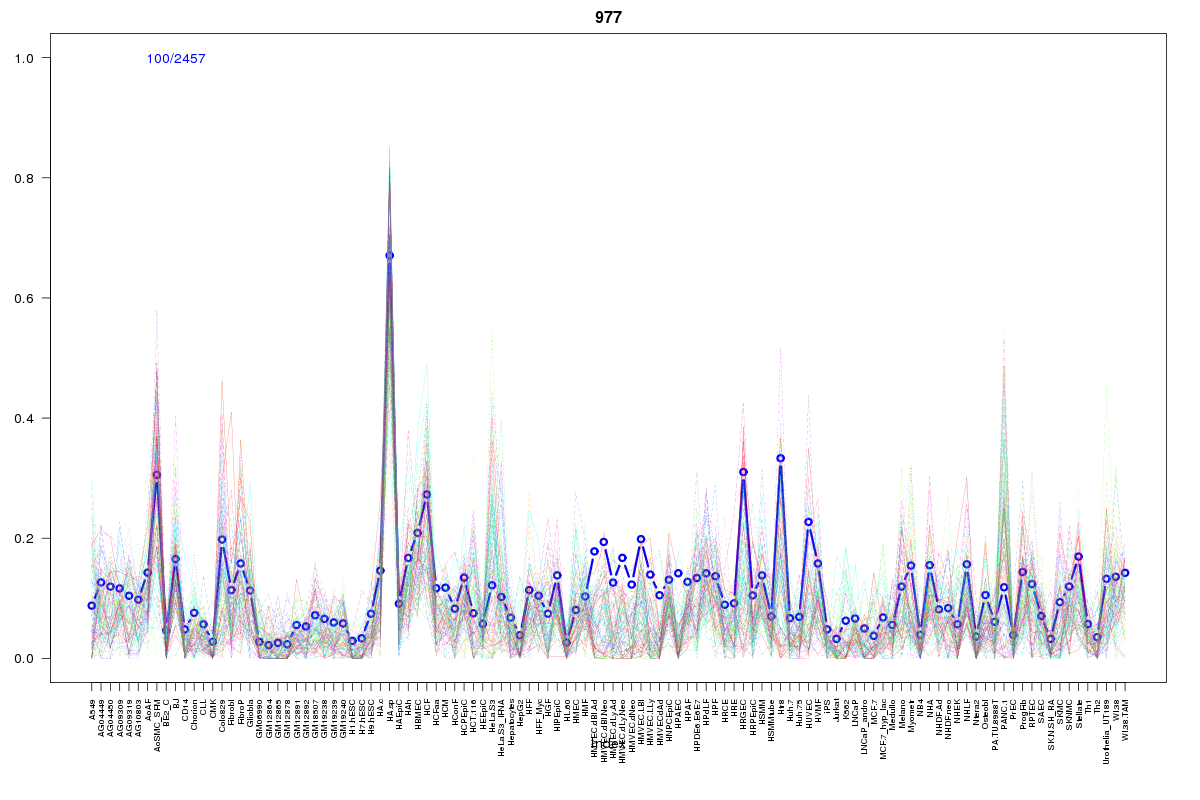 | 977 | 1 |
 | 862 | 1 |
 | 1605 | 1 |
Resources
BED file downloads
Connects to 16 DHS sitesTop 10 Correlated DHS Sites
p-values indiciate significant higher or lower correlation| Location | Cluster | P-value |
|---|---|---|
| chr3:189635300-189635450 | 1605 | 0.002 |
| chr3:189633620-189633770 | 862 | 0.008 |
| chr3:189659580-189659730 | 2000 | 0.01 |
| chr3:189755940-189756090 | 2133 | 0.01 |
| chr3:189632980-189633130 | 977 | 0.01 |
| chr3:189730120-189730270 | 161 | 0.01 |
| chr3:189655220-189655370 | 2448 | 0.01 |
| chr3:189700440-189700590 | 935 | 0.012 |
| chr3:189626540-189626690 | 894 | 0.016 |
| chr3:189776540-189776690 | 1760 | 0.016 |
| chr3:189659740-189659890 | 2262 | 0.021 |
External Databases
UCSCEnsembl (ENSG00000230077)