Gene: TBL1XR1-AS1
chr3: 176762648-176765711Expression Profile
(log scale)
Graphical Connections
Distribution of linked clusters:
You may find it interesting if many of the connected DHS sites belong to the same cluster.| Cluster Profile | Cluster ID | Number of DHS sites in this cluster |
|---|---|---|
 | 2186 | 8 |
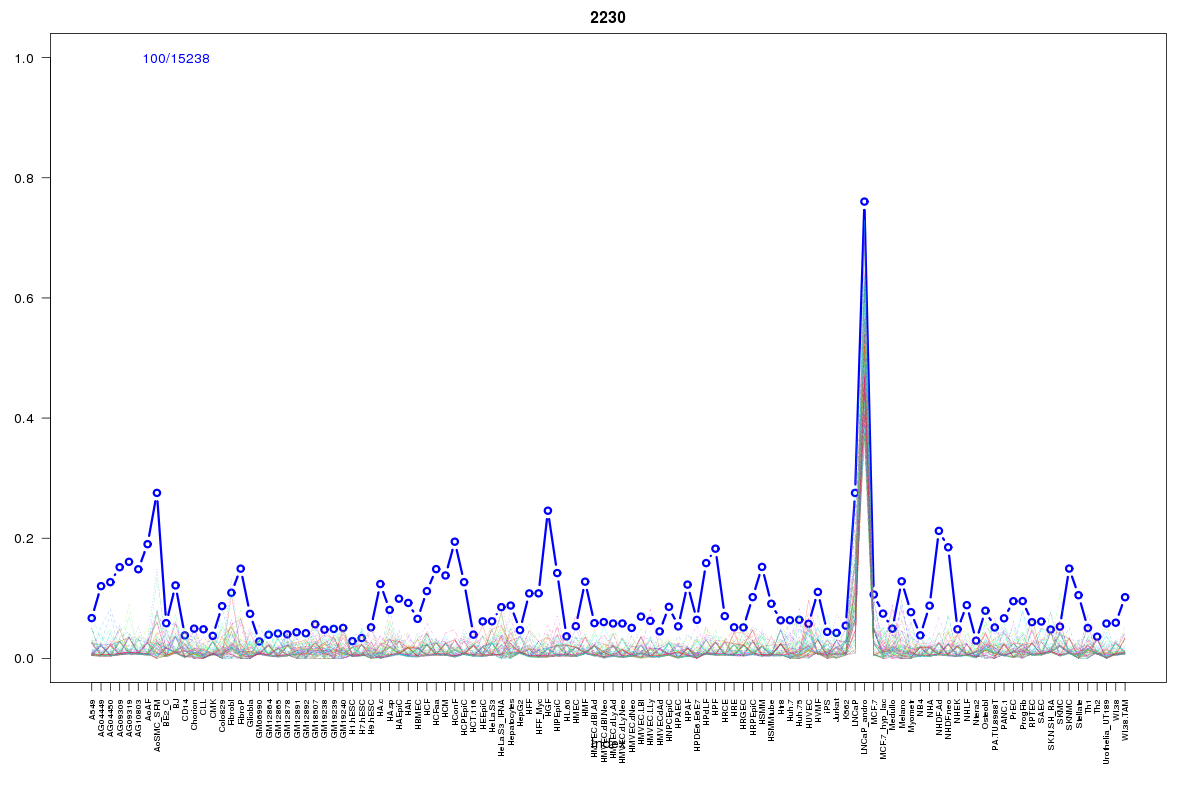 | 2230 | 5 |
 | 1605 | 2 |
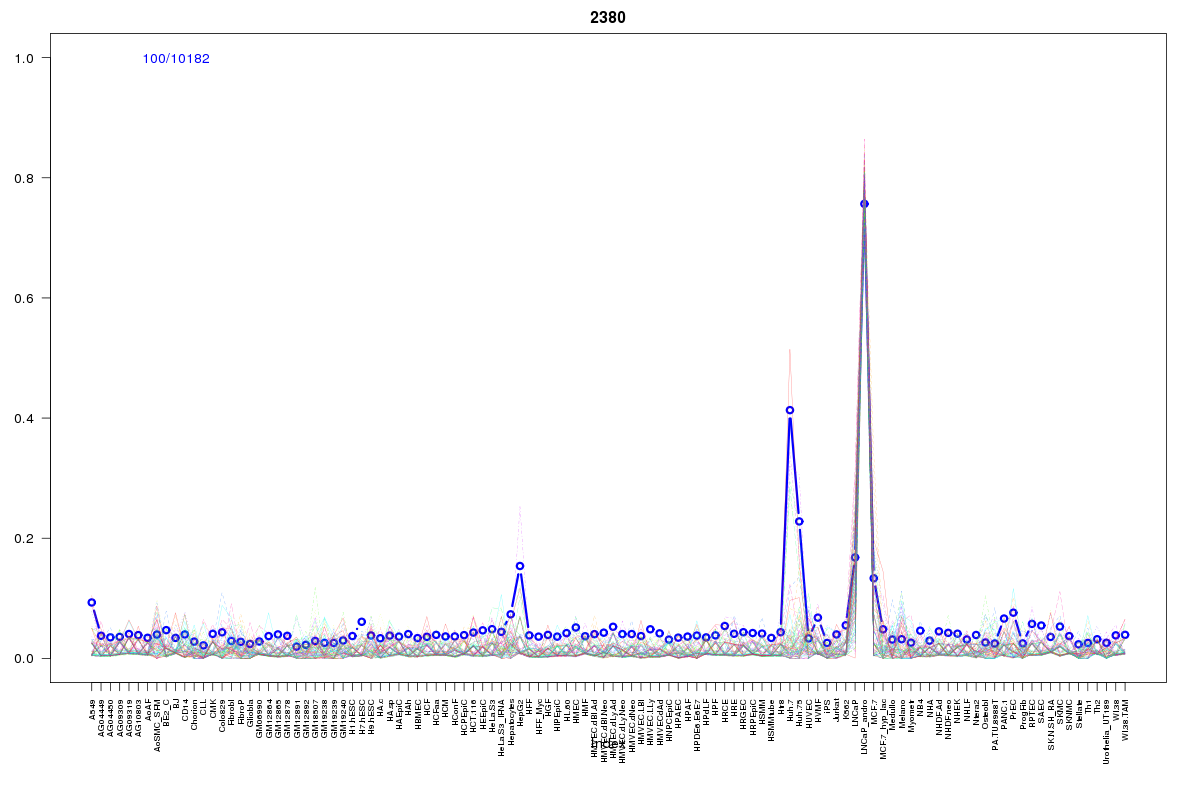 | 2380 | 1 |
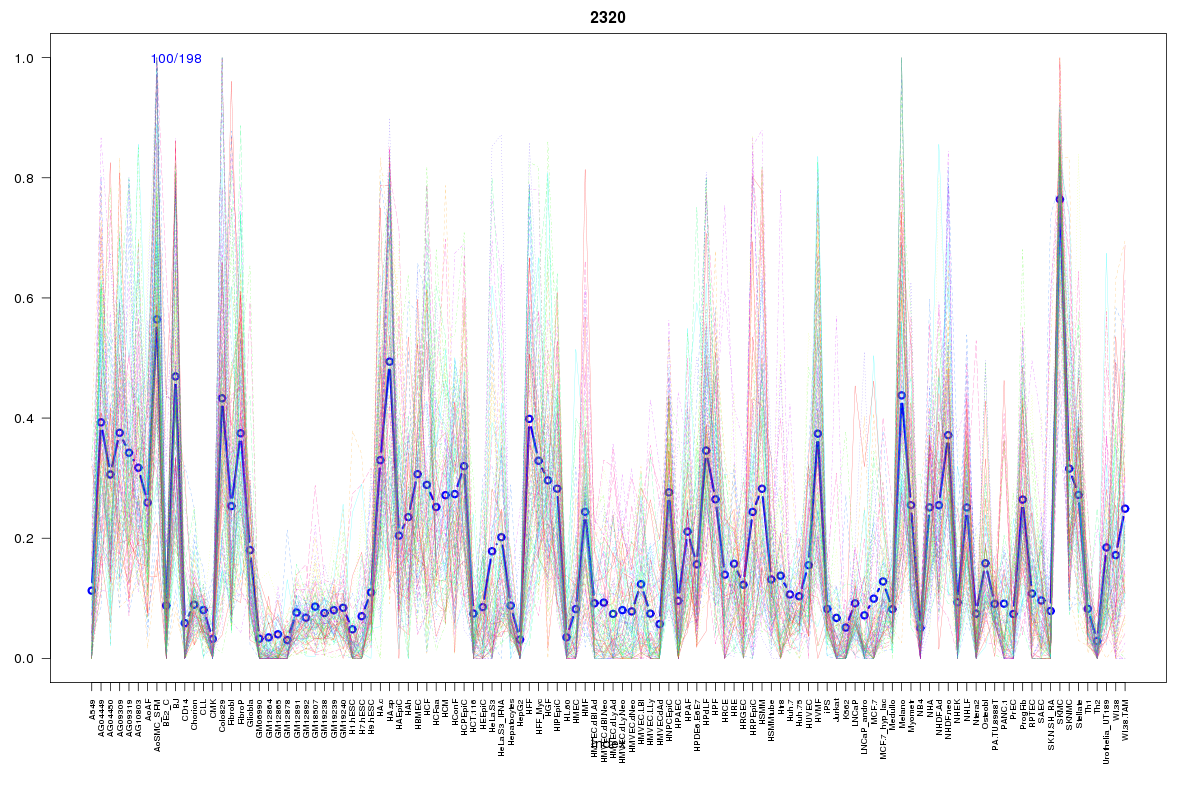 | 2320 | 1 |
 | 2326 | 1 |
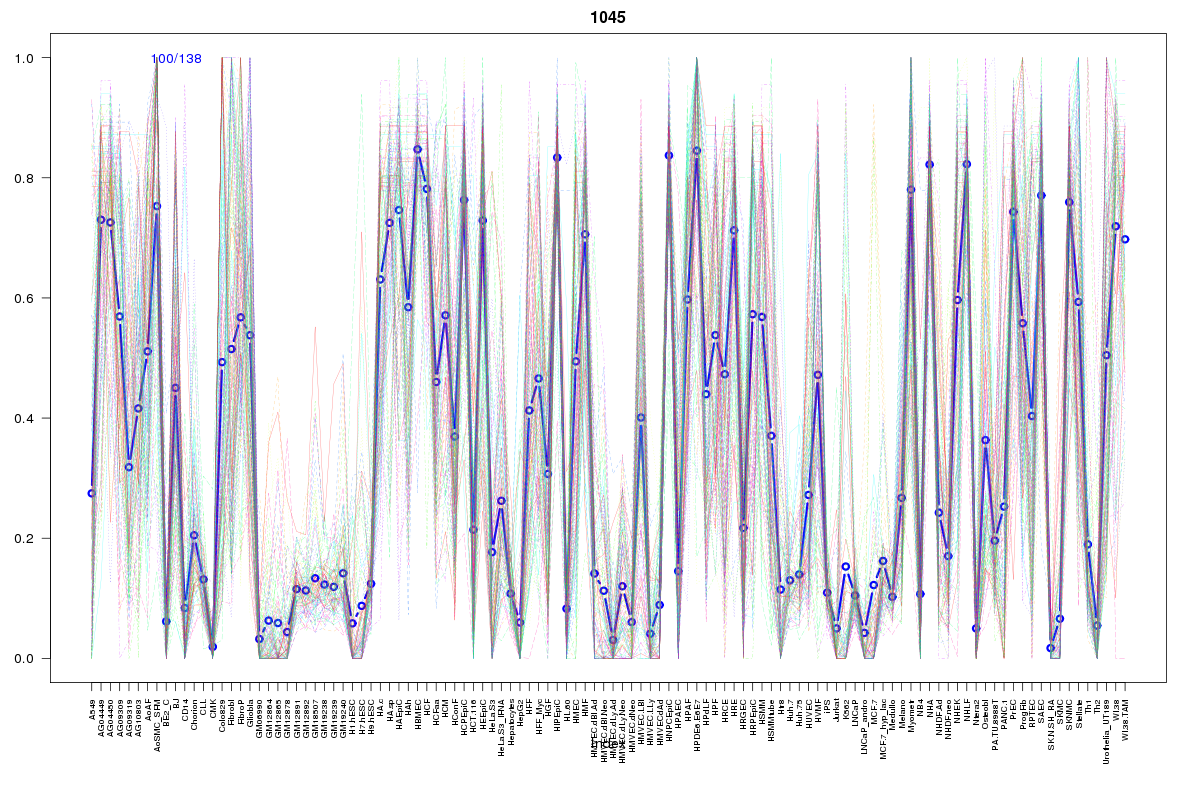 | 1045 | 1 |
Resources
BED file downloads
Connects to 19 DHS sitesTop 10 Correlated DHS Sites
p-values indiciate significant higher or lower correlation| Location | Cluster | P-value |
|---|---|---|
| chr3:176738440-176738590 | 2186 | 0.003 |
| chr3:176692120-176692270 | 2230 | 0.006 |
| chr3:176771040-176771190 | 2186 | 0.008 |
| chr3:176753485-176753635 | 2230 | 0.008 |
| chr3:176735740-176735890 | 2186 | 0.009 |
| chr3:176758940-176759090 | 2380 | 0.009 |
| chr3:176771280-176771430 | 2186 | 0.012 |
| chr3:176765880-176766030 | 2230 | 0.014 |
| chr3:176844900-176845050 | 1605 | 0.015 |
| chr3:176826560-176826710 | 1605 | 0.016 |
| chr3:176851100-176851250 | 2186 | 0.016 |
External Databases
UCSCEnsembl (ENSG00000231310)