Gene: ASCL5
chr1: 201083080-201096312Expression Profile
(log scale)
Graphical Connections
Distribution of linked clusters:
You may find it interesting if many of the connected DHS sites belong to the same cluster.| Cluster Profile | Cluster ID | Number of DHS sites in this cluster |
|---|---|---|
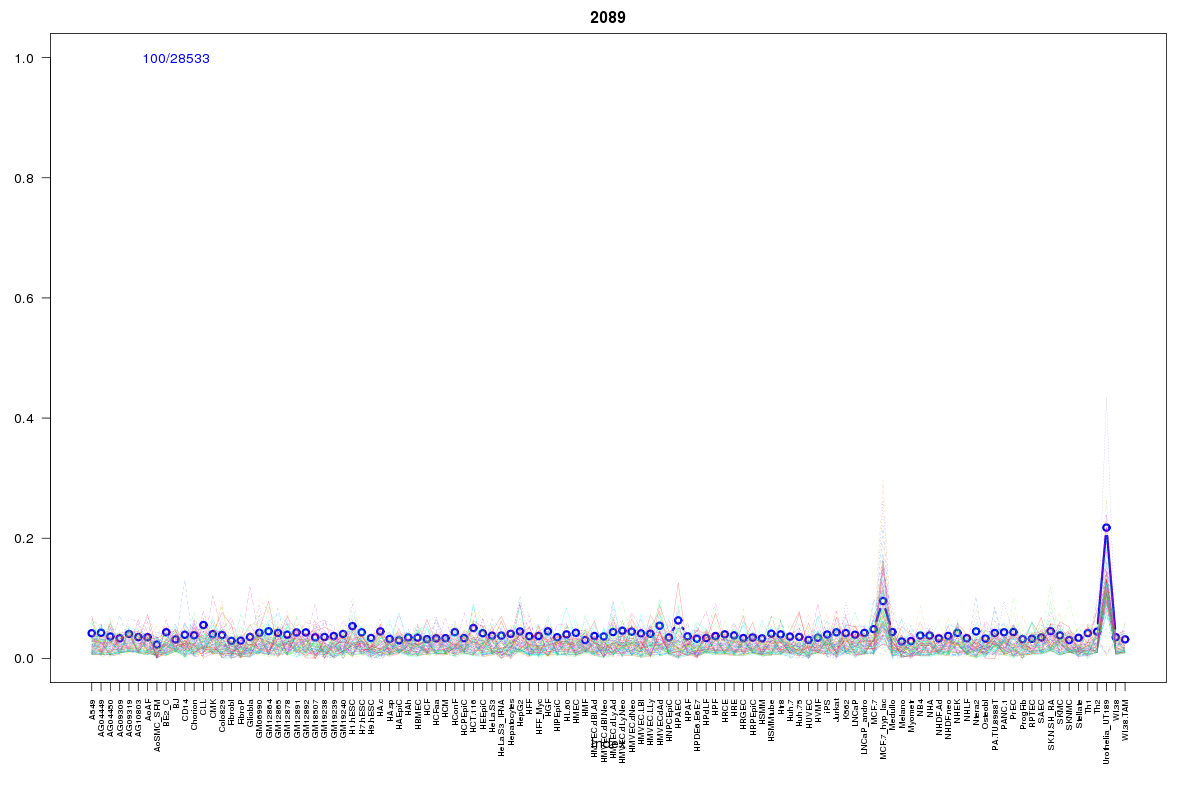 | 2089 | 6 |
 | 1755 | 3 |
 | 655 | 2 |
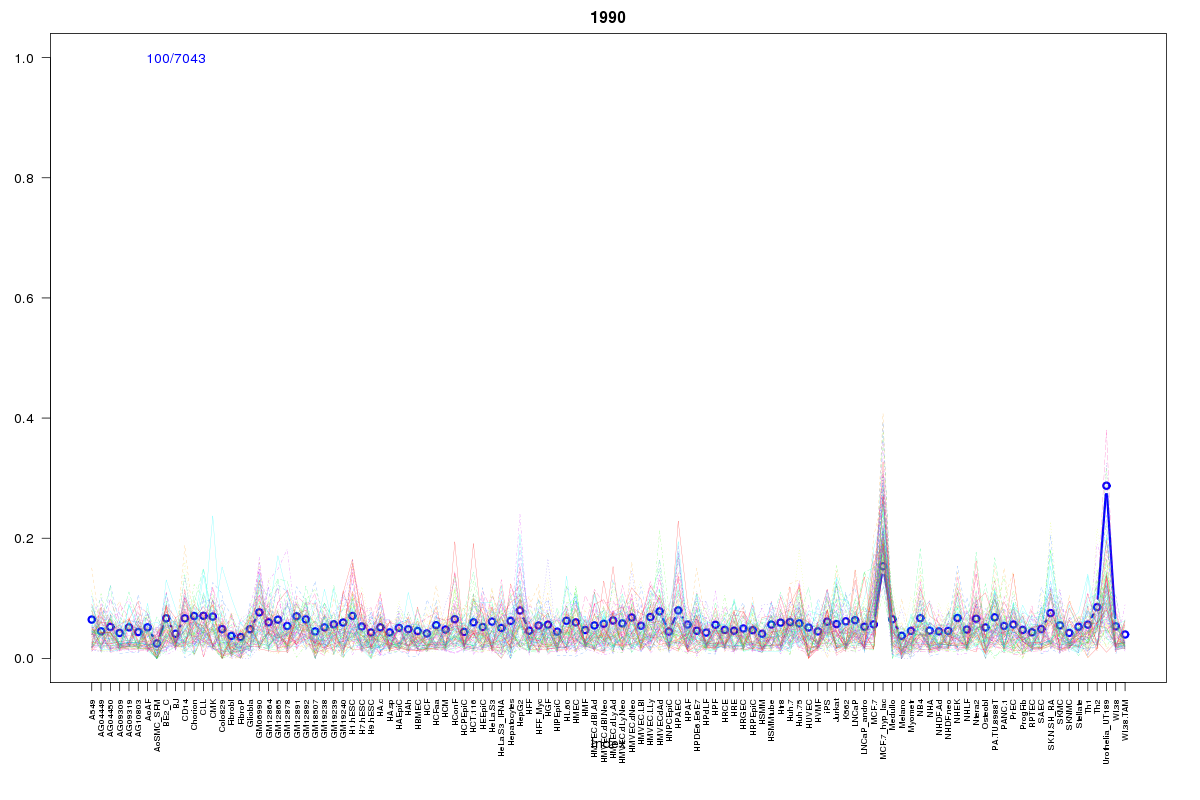 | 1990 | 2 |
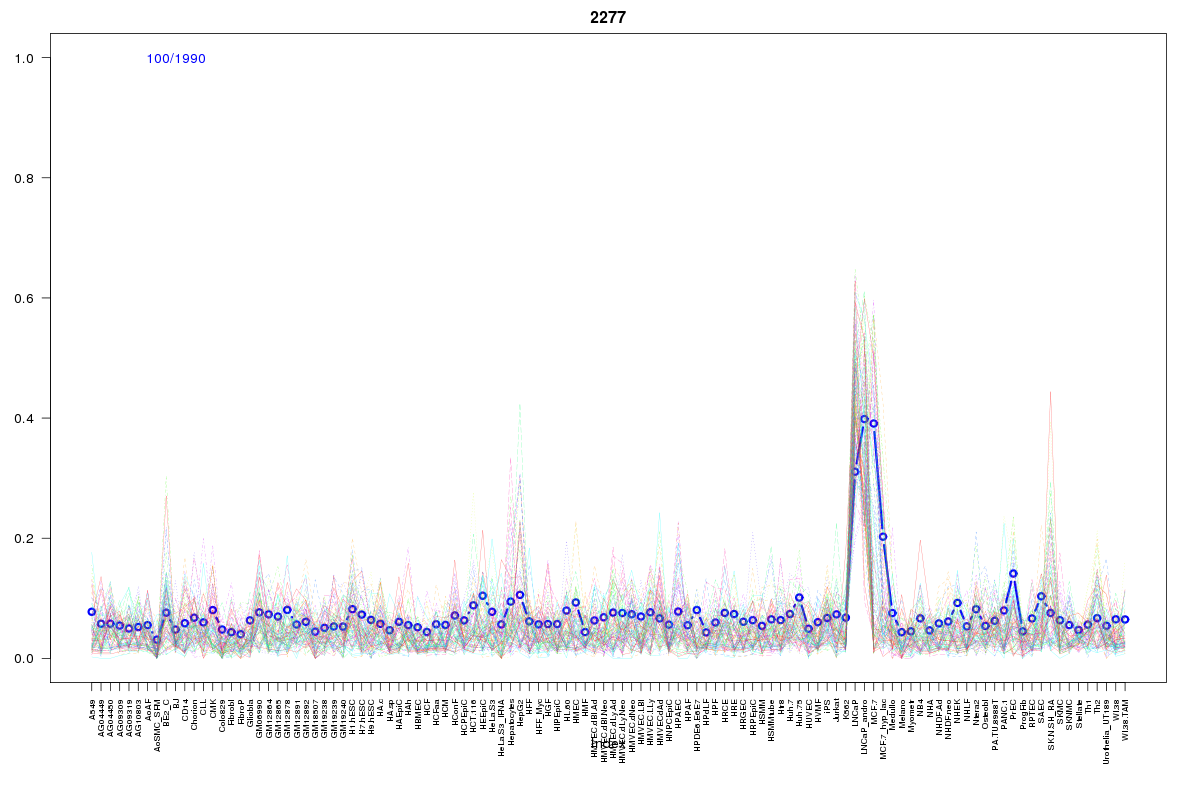 | 2277 | 1 |
 | 1355 | 1 |
 | 2186 | 1 |
 | 2055 | 1 |
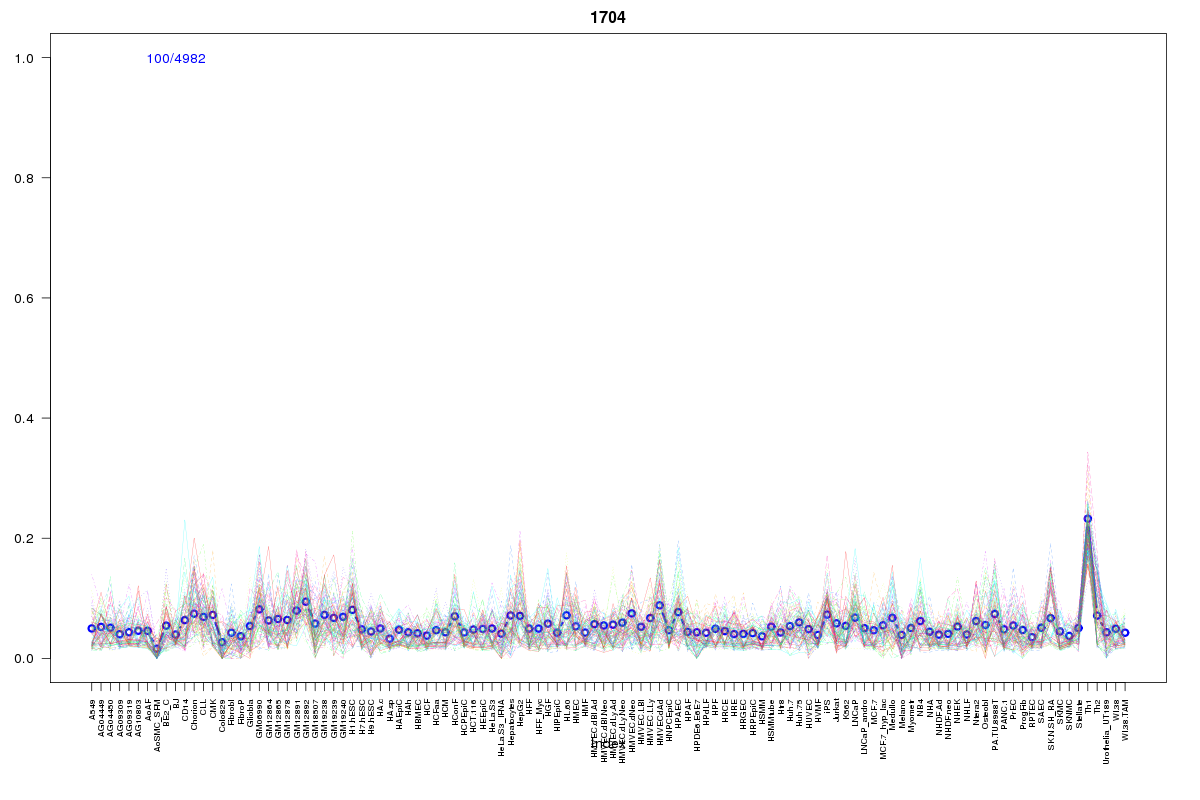 | 1704 | 1 |
 | 2052 | 1 |
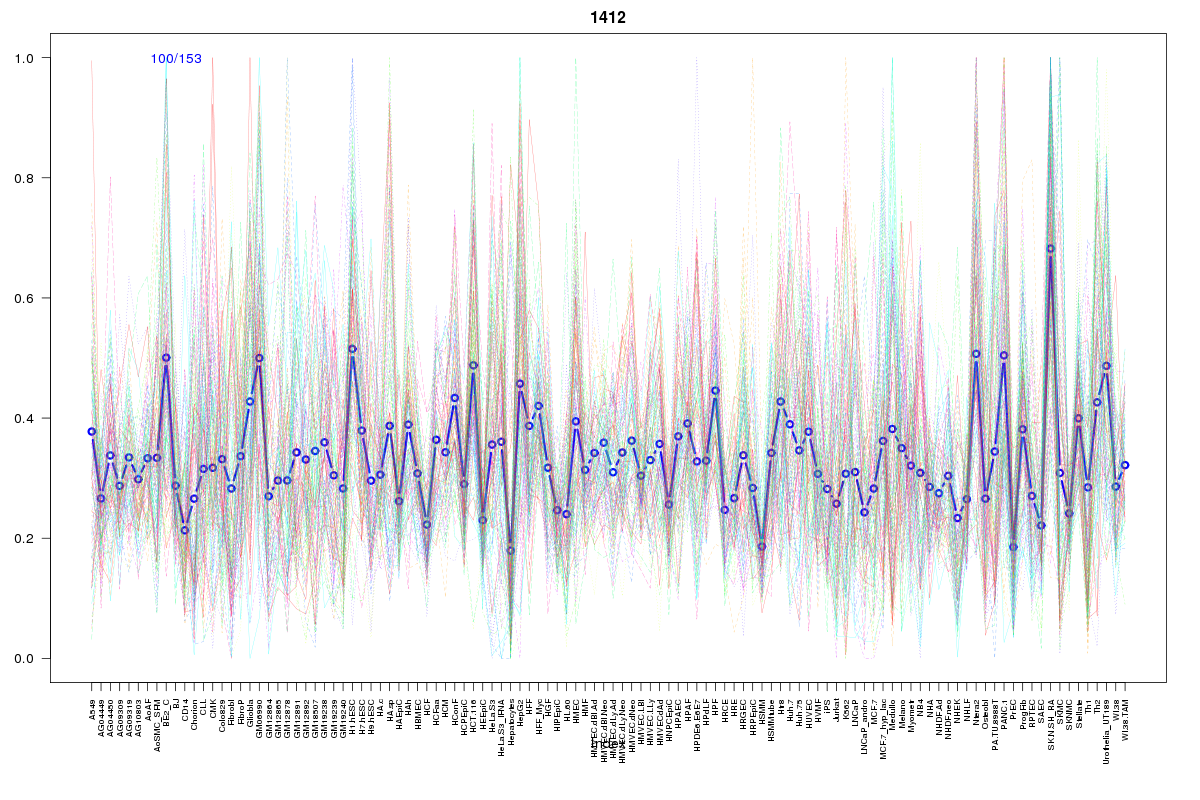 | 1412 | 1 |
 | 554 | 1 |
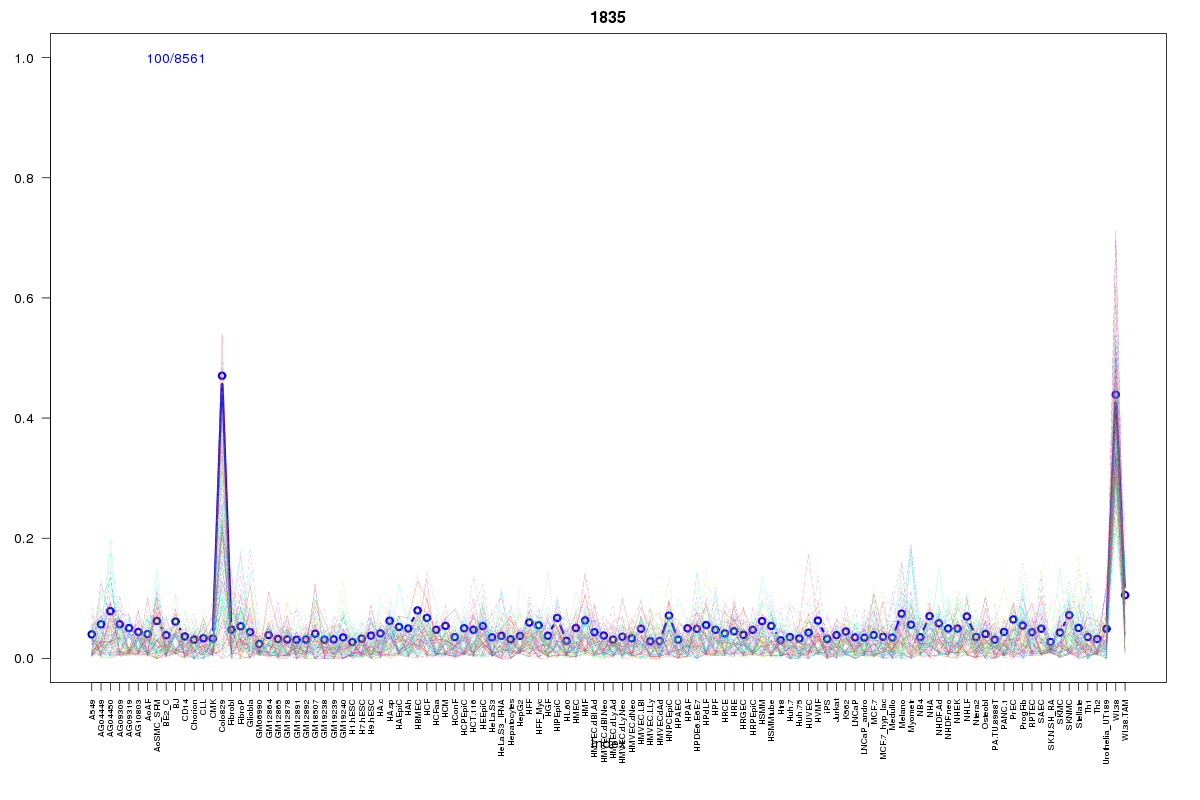 | 1835 | 1 |
 | 2062 | 1 |
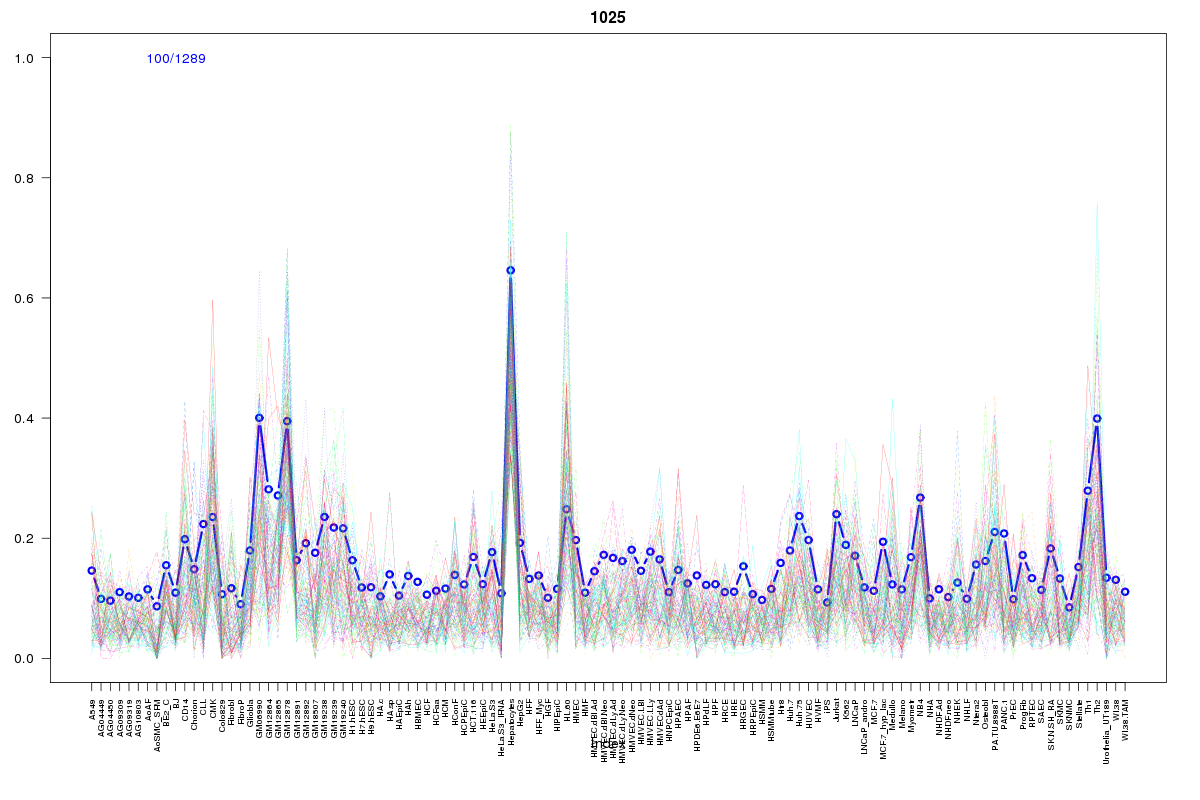 | 1025 | 1 |
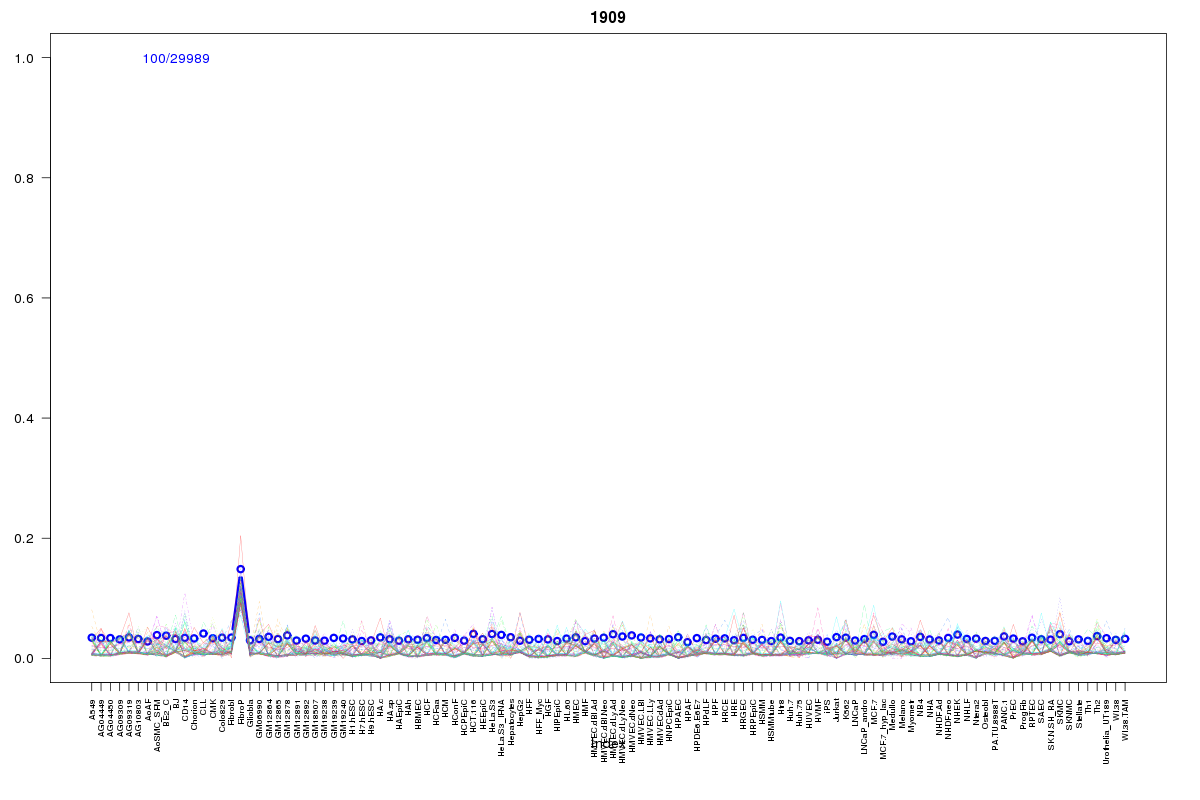 | 1909 | 1 |
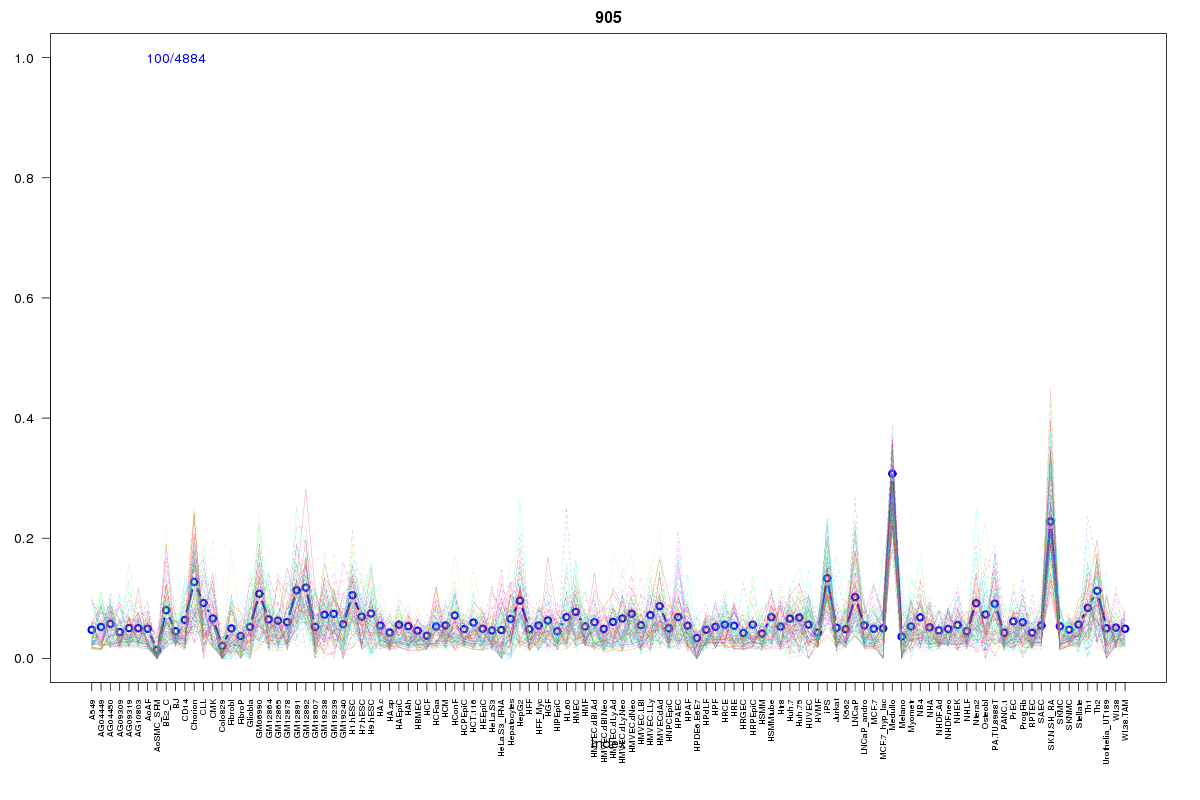 | 905 | 1 |
Resources
BED file downloads
Connects to 26 DHS sitesTop 10 Correlated DHS Sites
p-values indiciate significant higher or lower correlation| Location | Cluster | P-value |
|---|---|---|
| chr1:201011820-201011970 | 905 | 0.002 |
| chr1:201095065-201095215 | 655 | 0.013 |
| chr1:201032385-201032535 | 1355 | 0.02 |
| chr1:201024840-201024990 | 2277 | 0.02 |
| chr1:201055645-201055795 | 2186 | 0.022 |
| chr1:201053785-201053935 | 655 | 0.022 |
| chr1:201005625-201005775 | 1909 | 0.022 |
| chr1:200985500-200985650 | 554 | 0.023 |
| chr1:201019005-201019155 | 1990 | 0.022 |
| chr1:200991465-200991615 | 2062 | 0.021 |
| chr1:200994345-200994495 | 1990 | 0.017 |
External Databases
UCSCEnsembl (ENSG00000232237)