Gene: PTCD2P2
chr10: 90636206-90637301Expression Profile
(log scale)
Graphical Connections
Distribution of linked clusters:
You may find it interesting if many of the connected DHS sites belong to the same cluster.| Cluster Profile | Cluster ID | Number of DHS sites in this cluster |
|---|---|---|
 | 15 | 9 |
 | 66 | 2 |
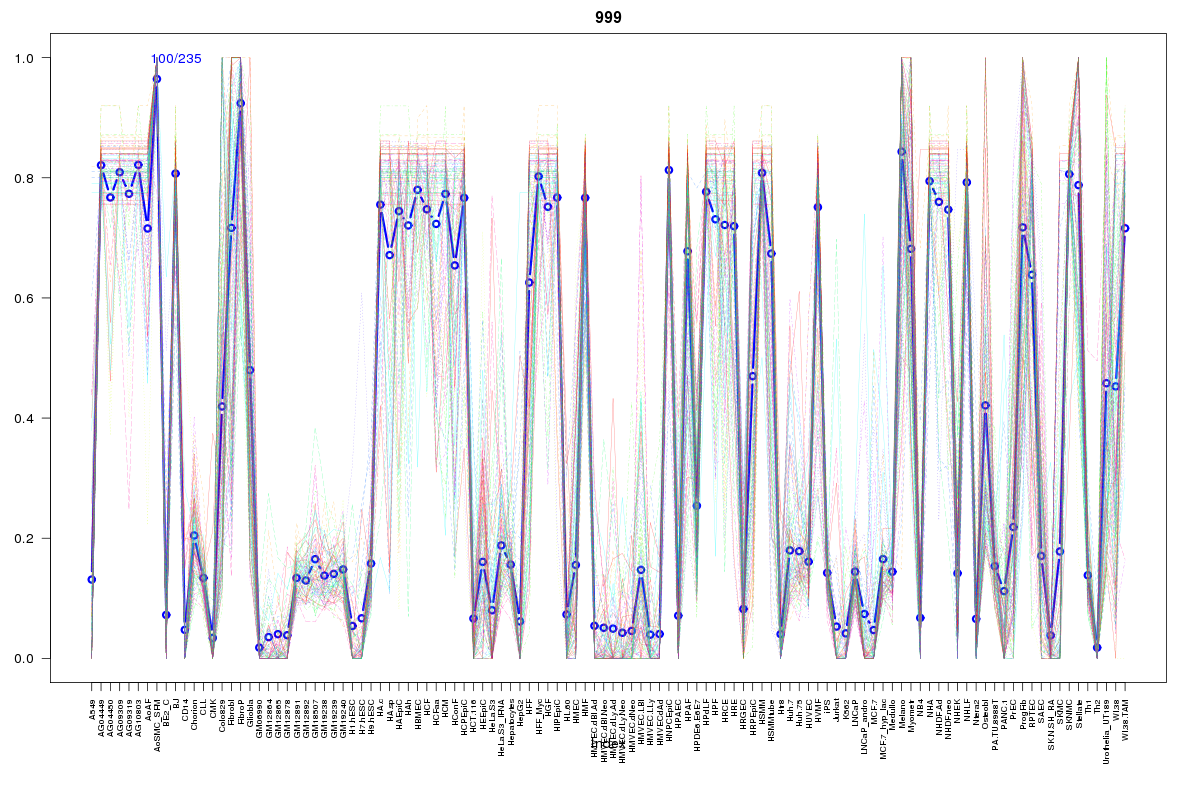 | 999 | 2 |
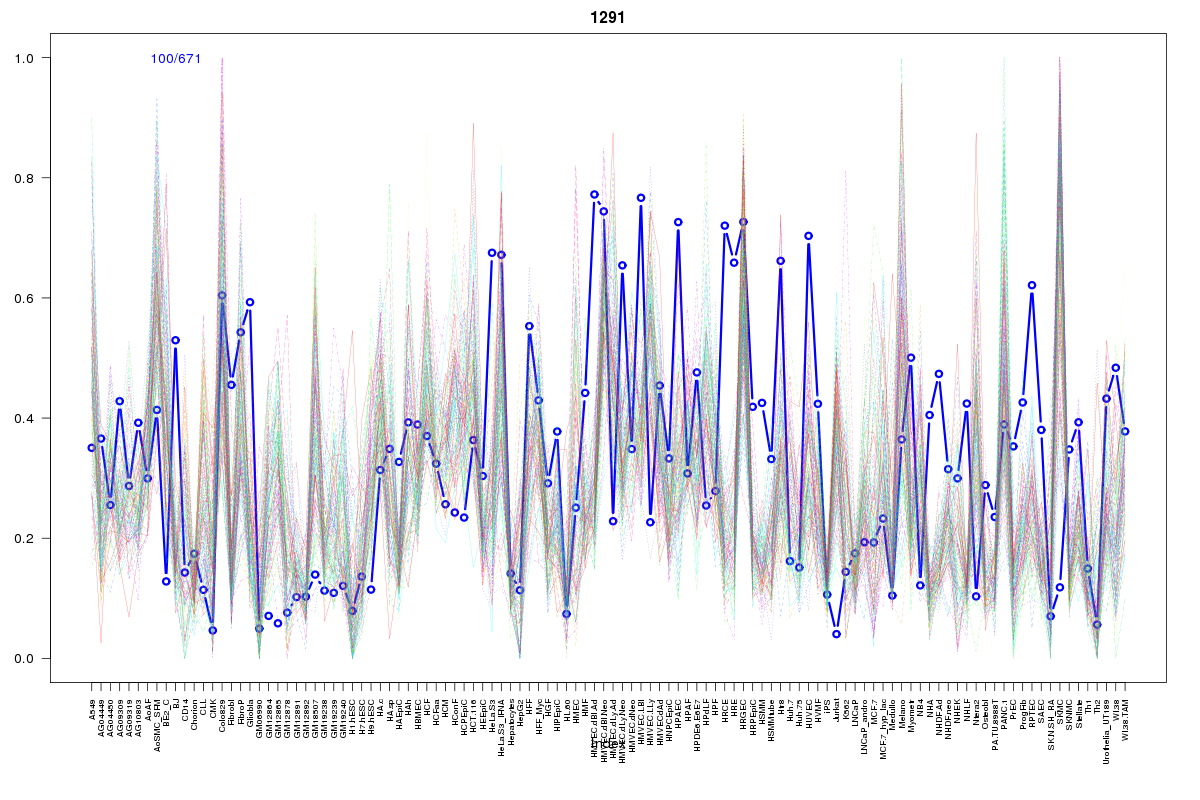 | 1291 | 1 |
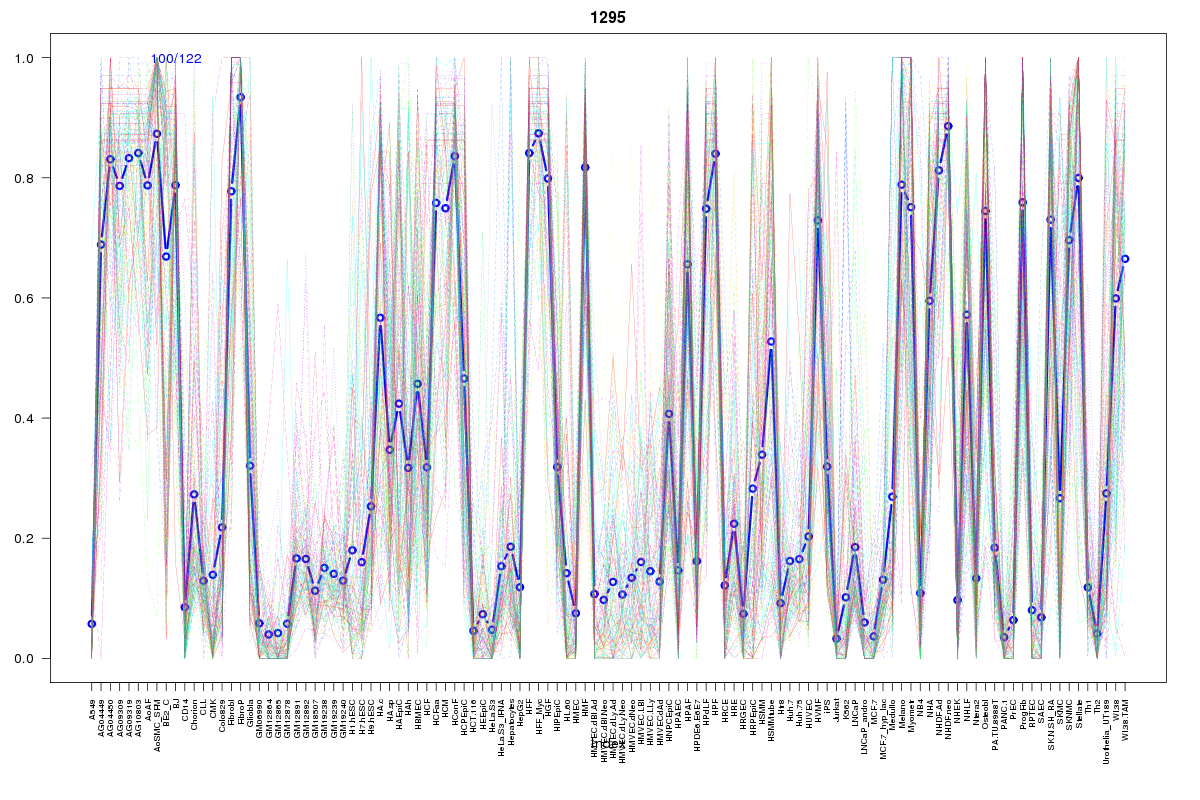 | 1295 | 1 |
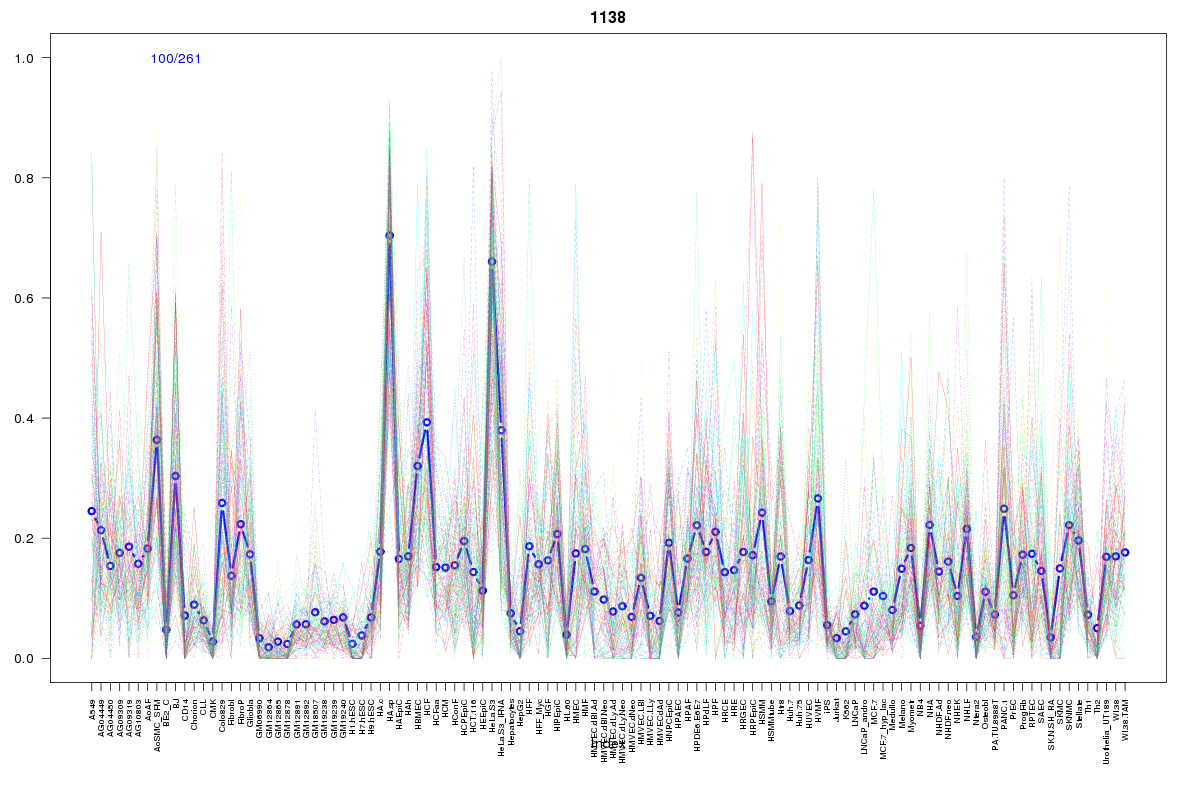 | 1138 | 1 |
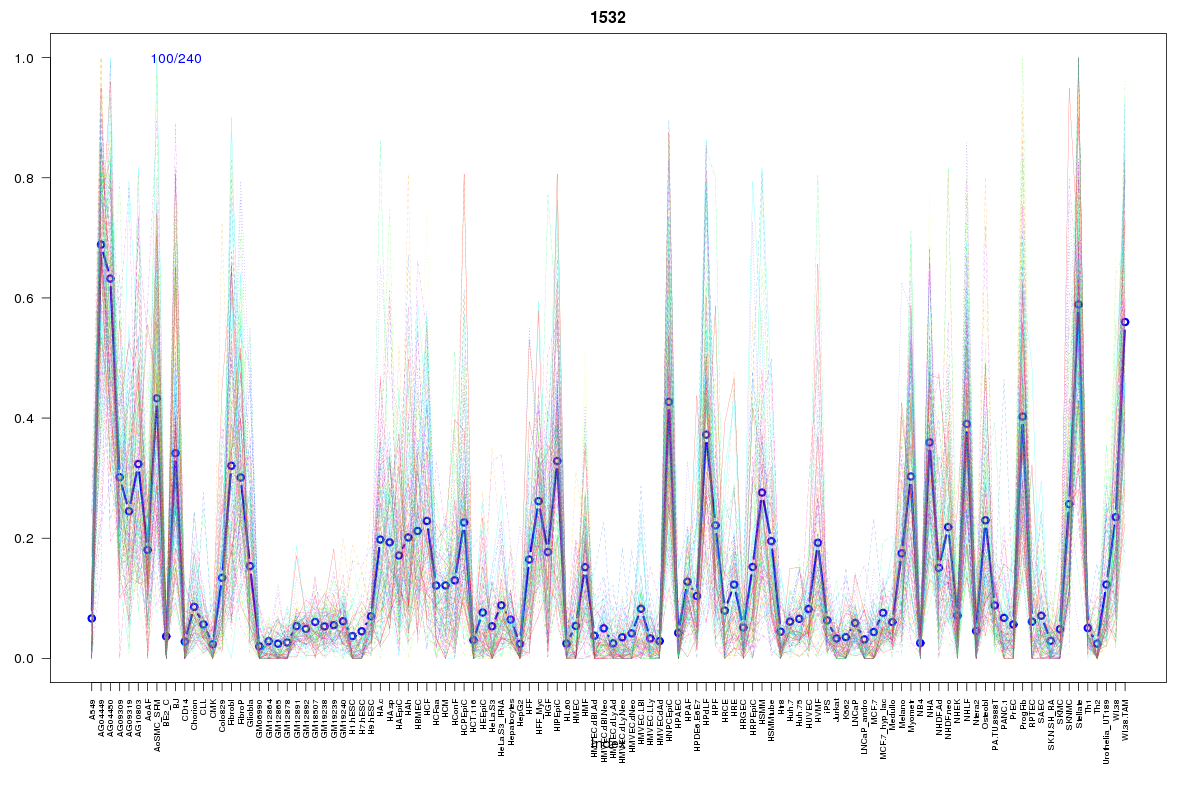 | 1532 | 1 |
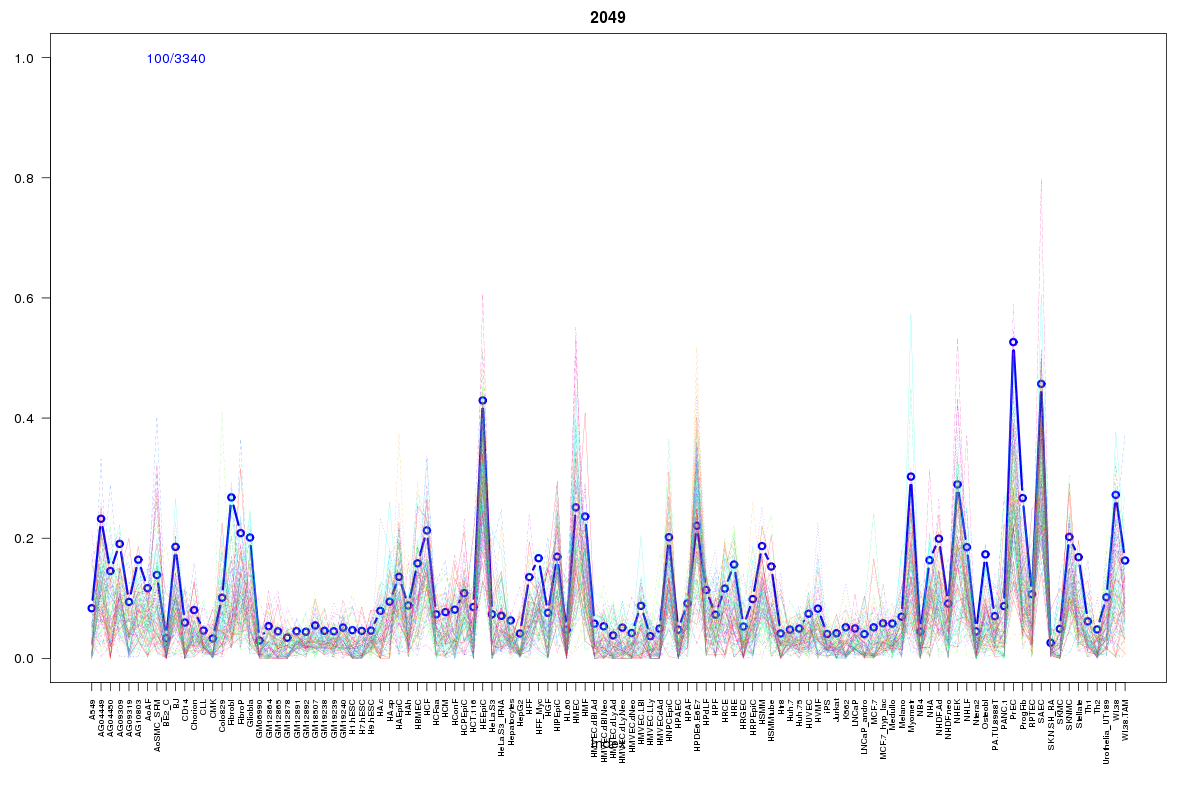 | 2049 | 1 |
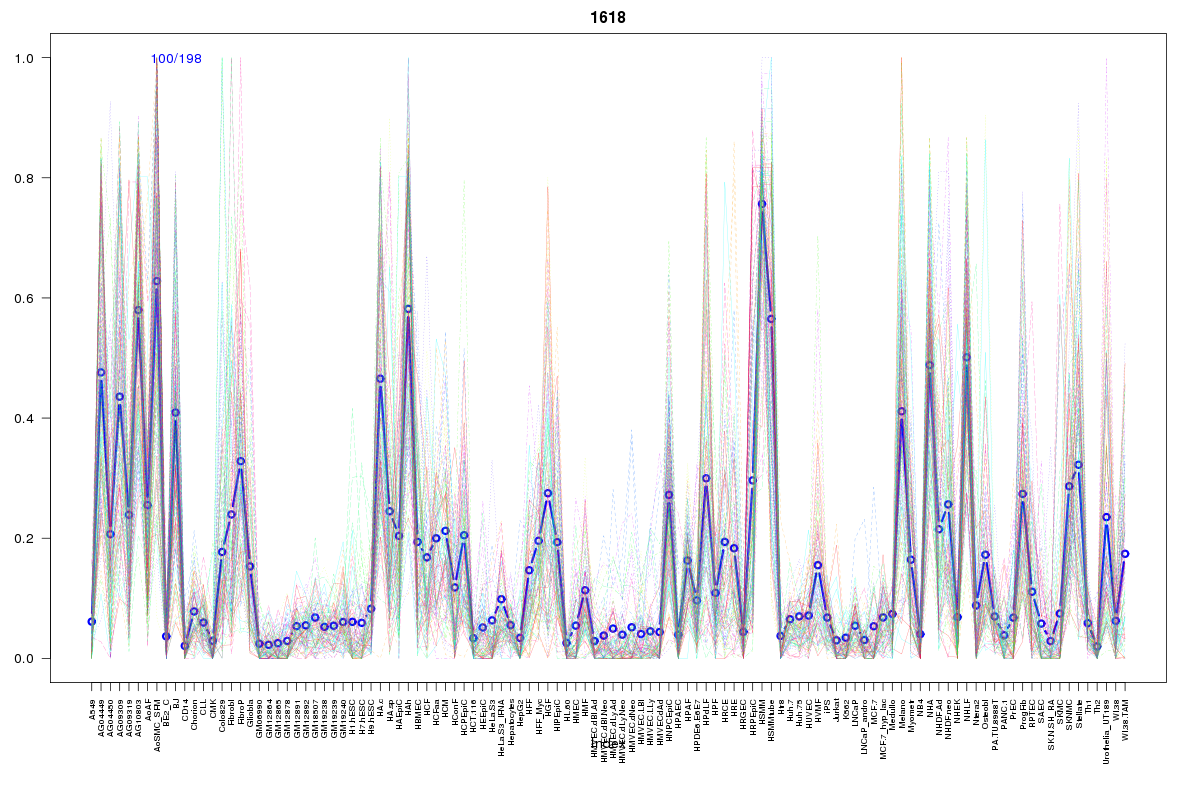 | 1618 | 1 |
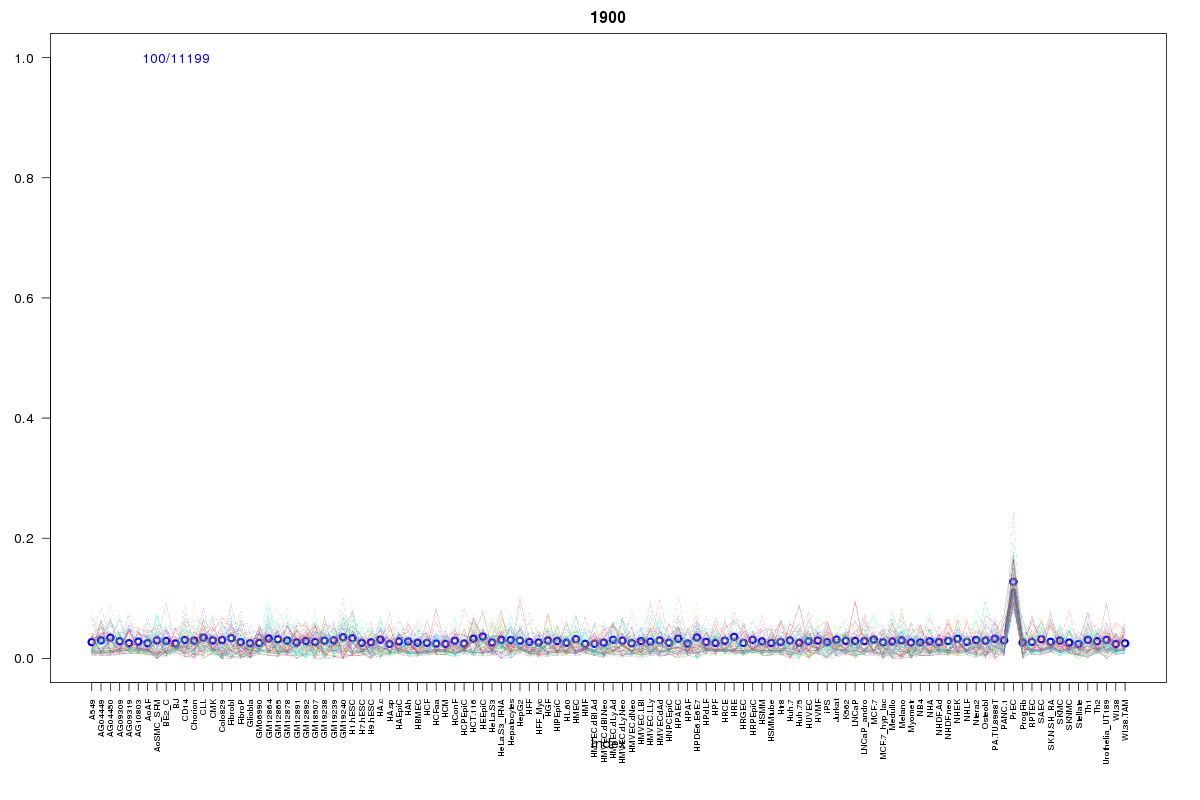 | 1900 | 1 |
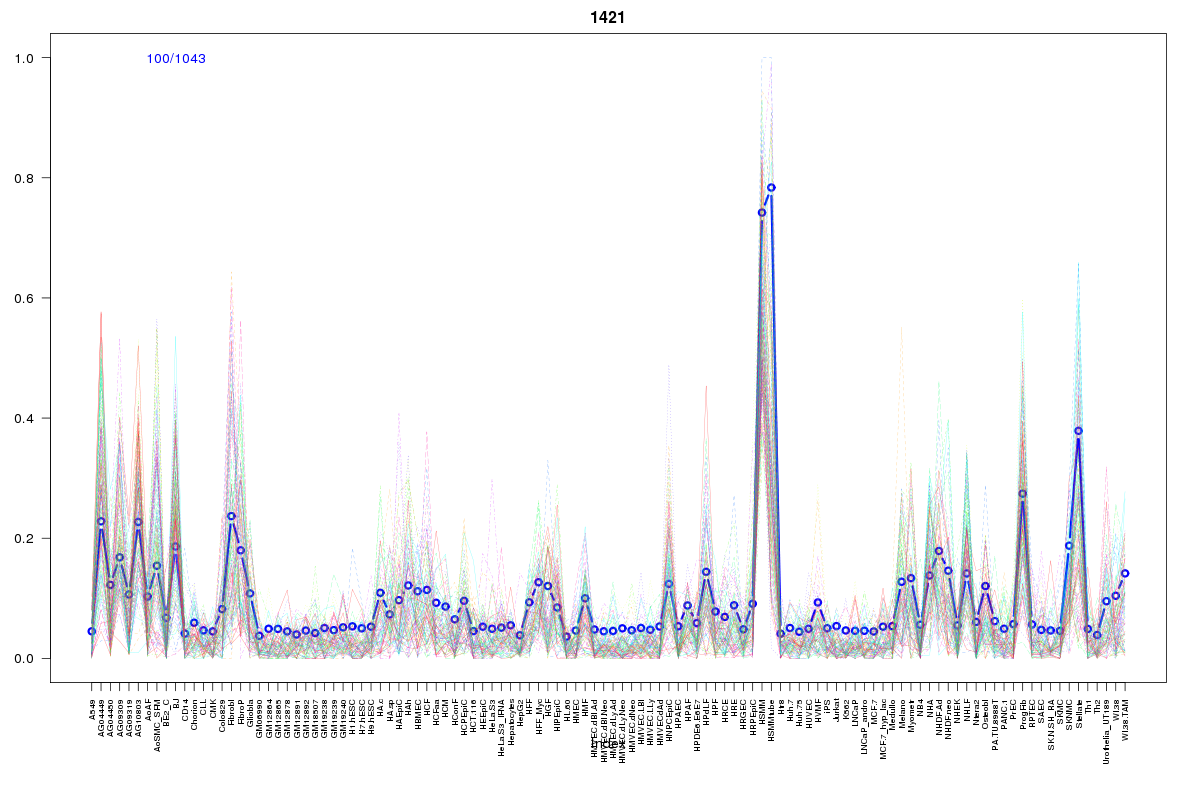 | 1421 | 1 |
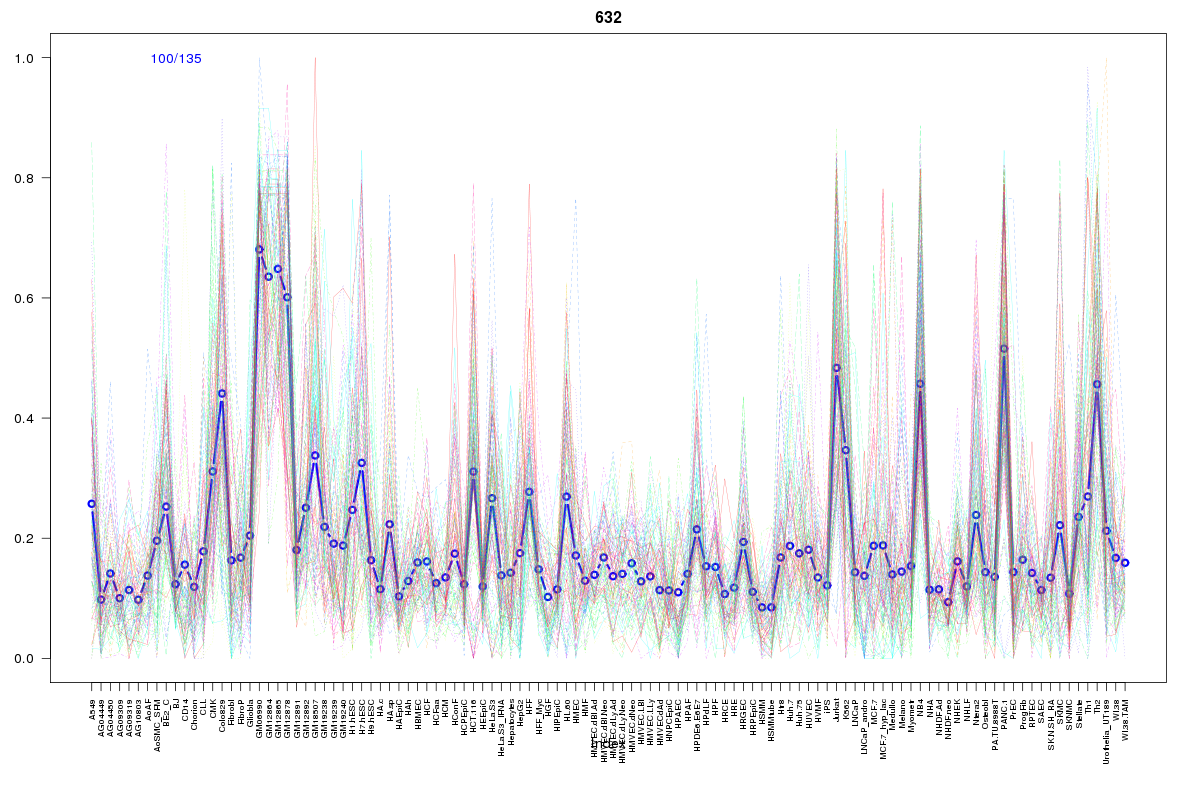 | 632 | 1 |
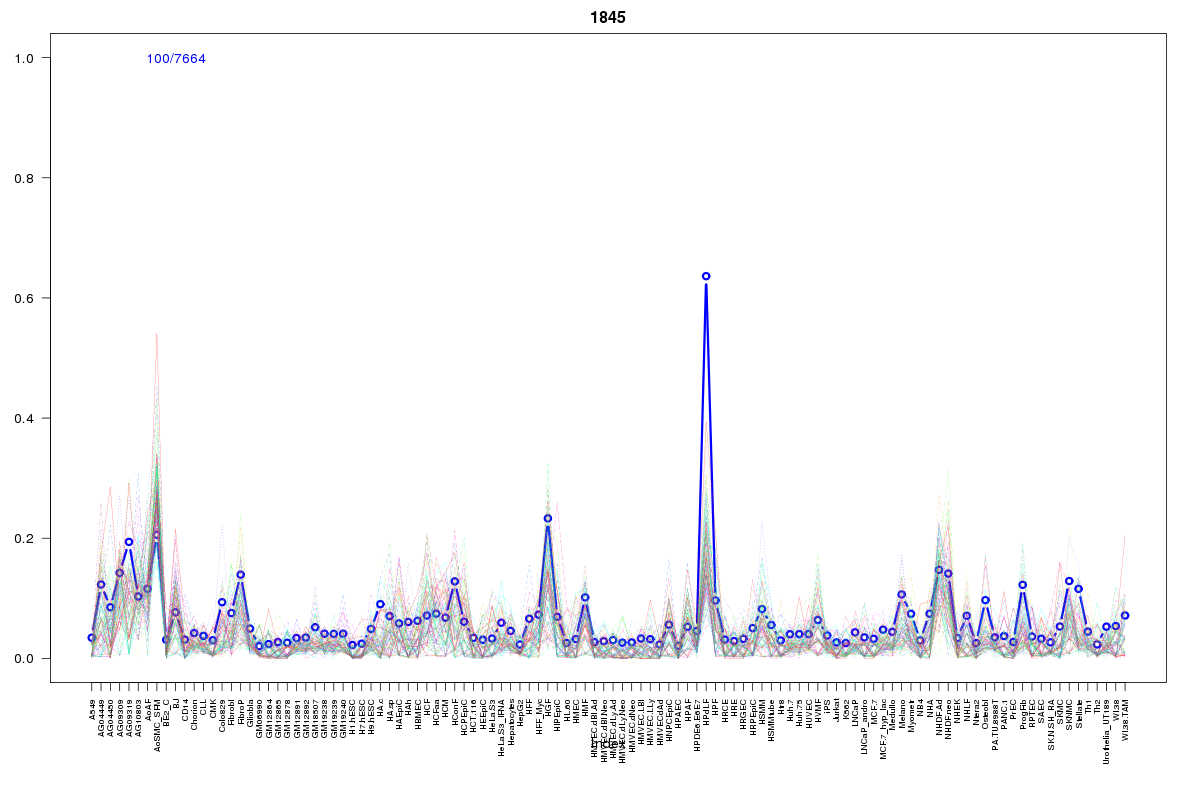 | 1845 | 1 |
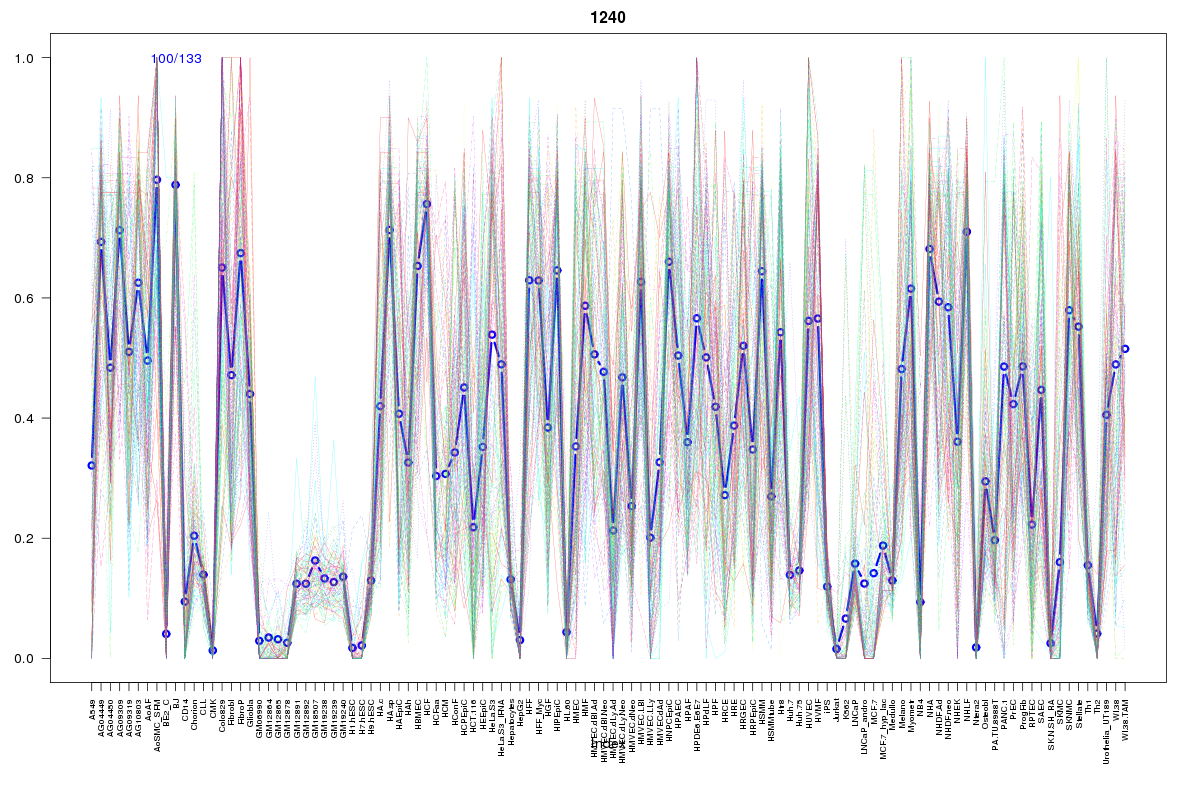 | 1240 | 1 |
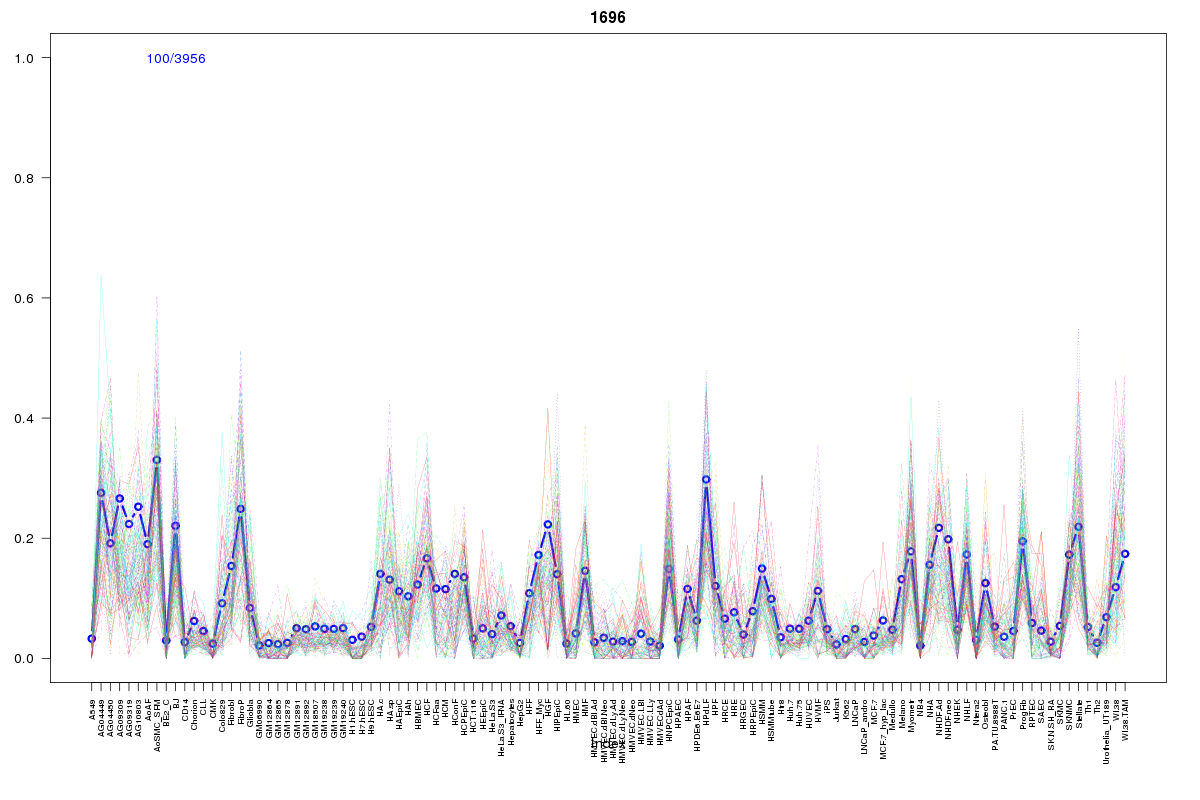 | 1696 | 1 |
 | 2211 | 1 |
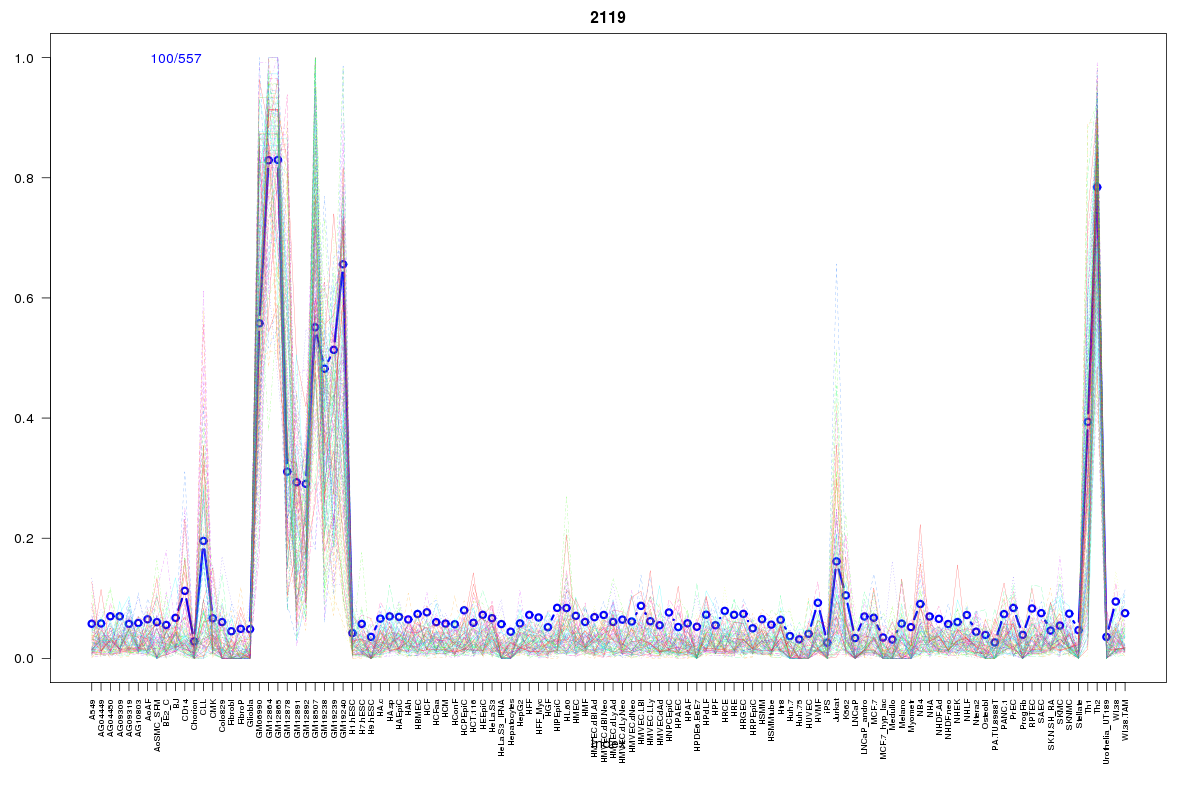 | 2119 | 1 |
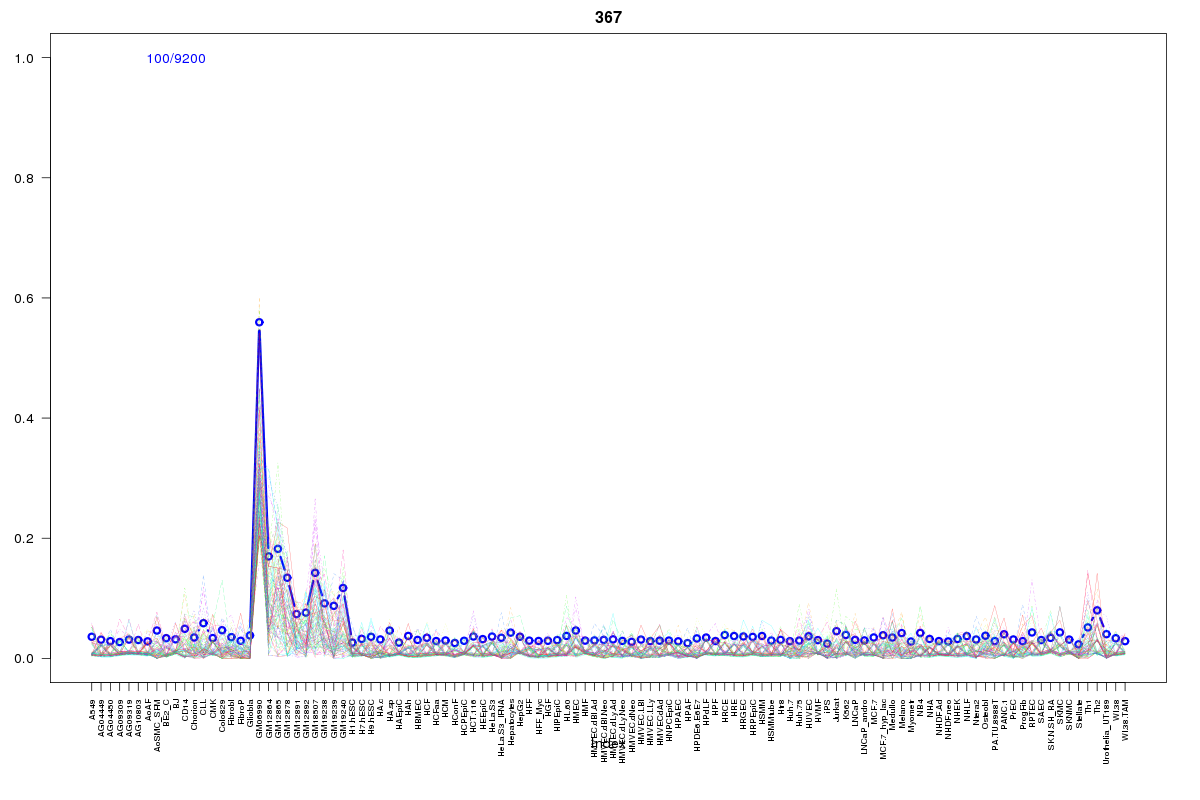 | 367 | 1 |
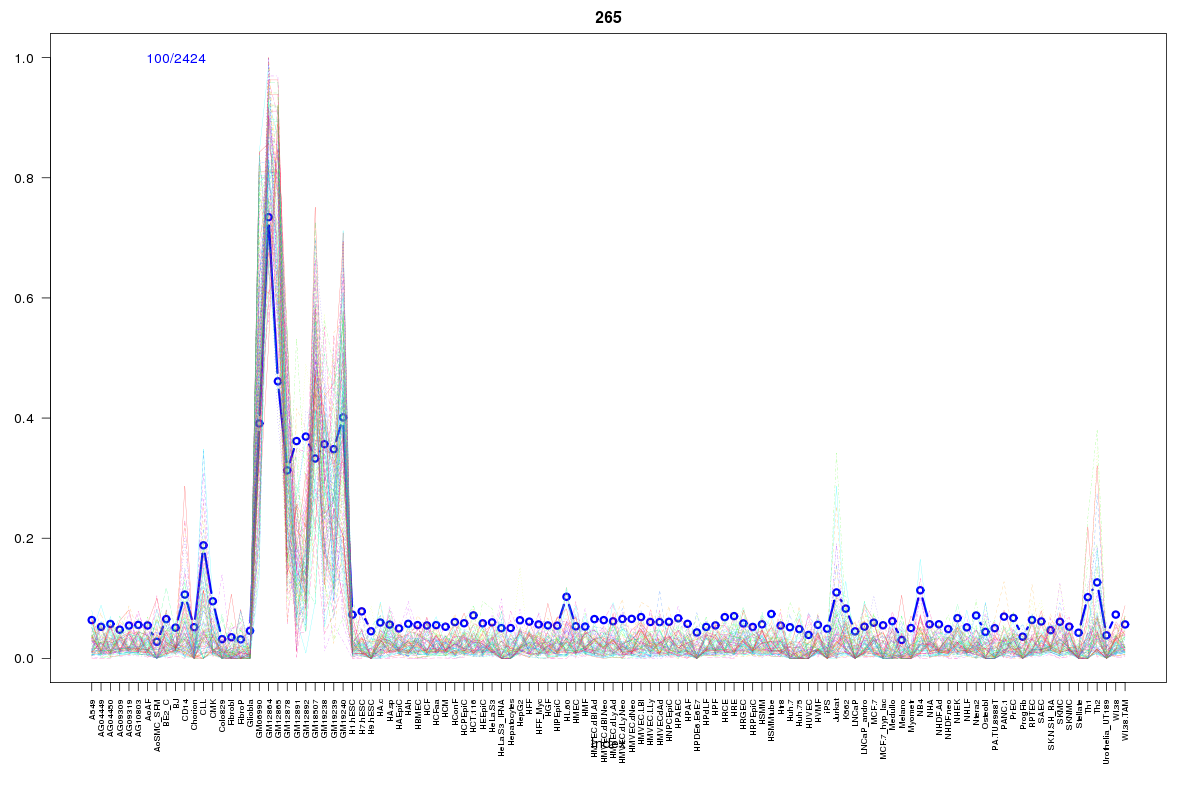 | 265 | 1 |
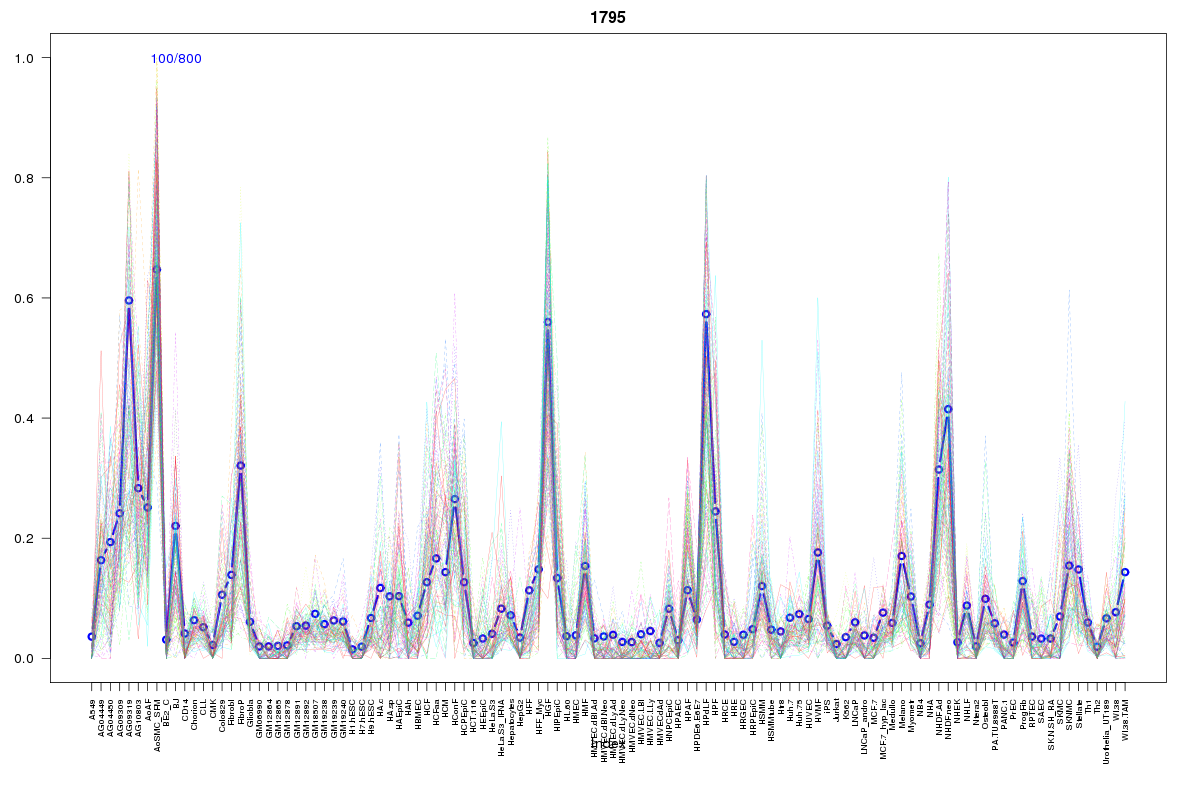 | 1795 | 1 |
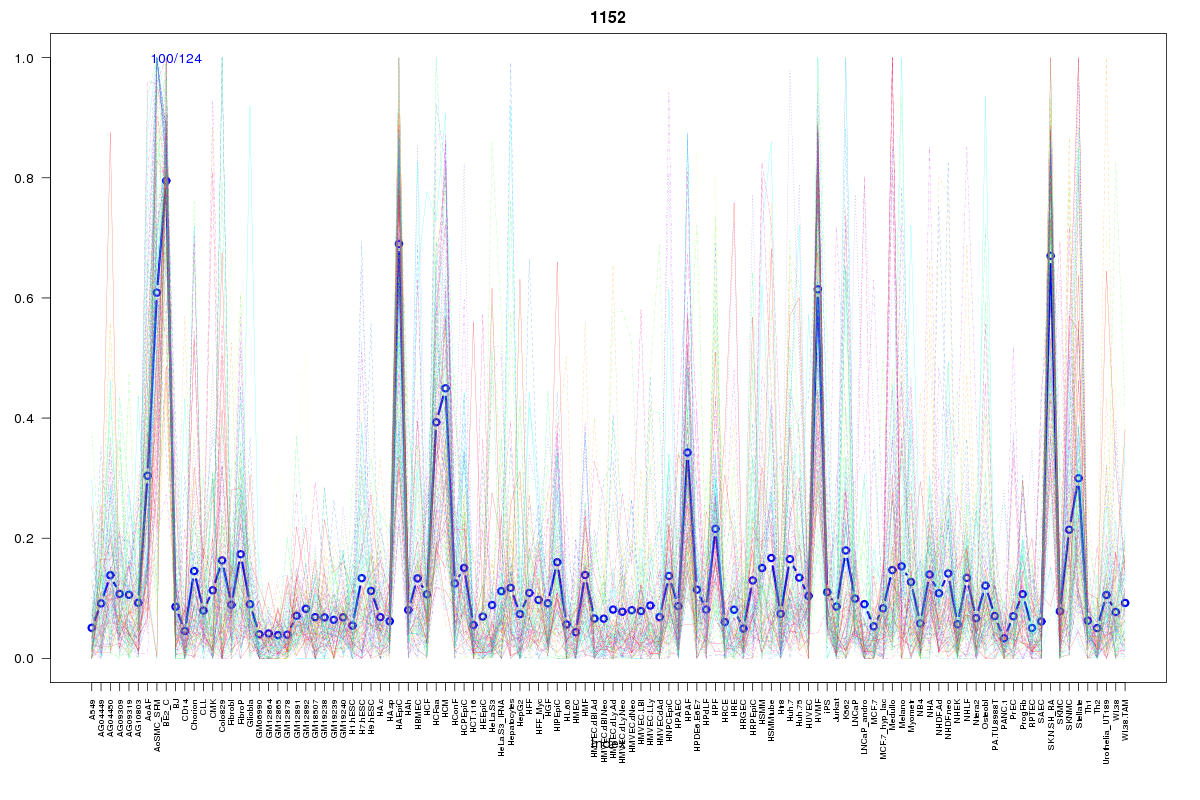 | 1152 | 1 |
 | 1099 | 1 |
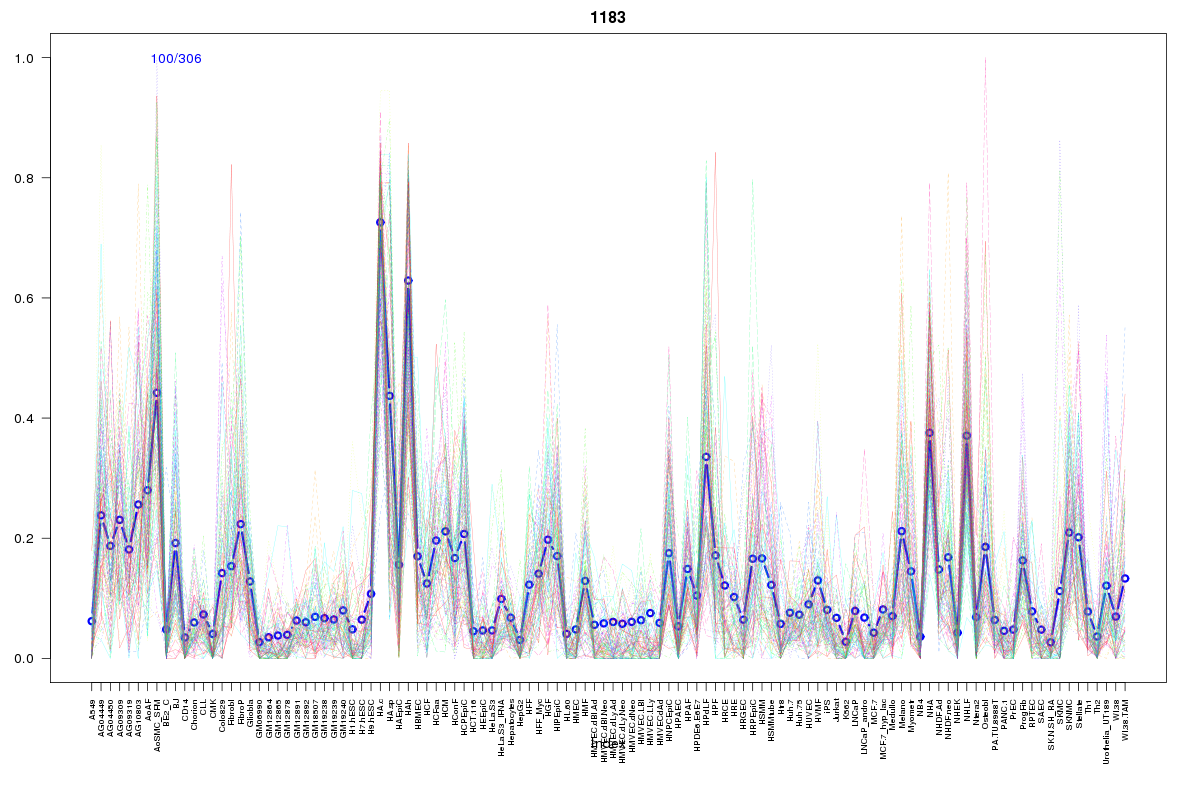 | 1183 | 1 |
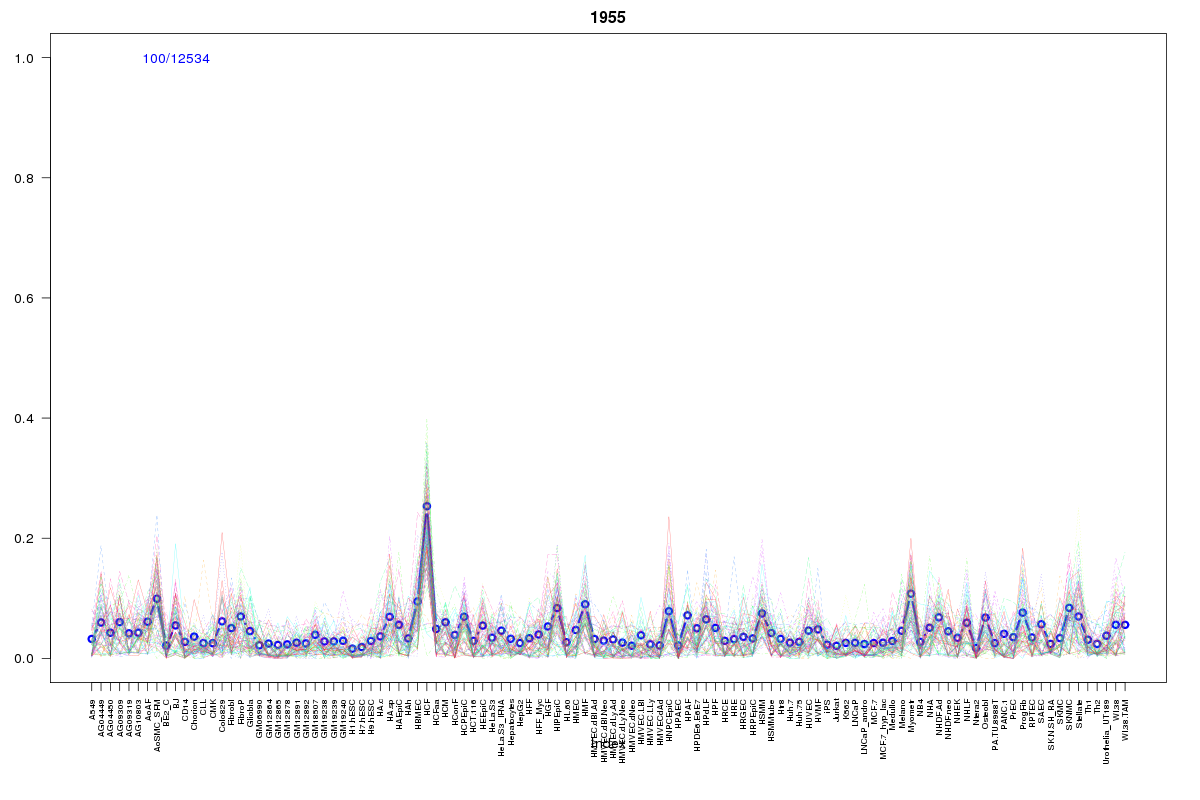 | 1955 | 1 |
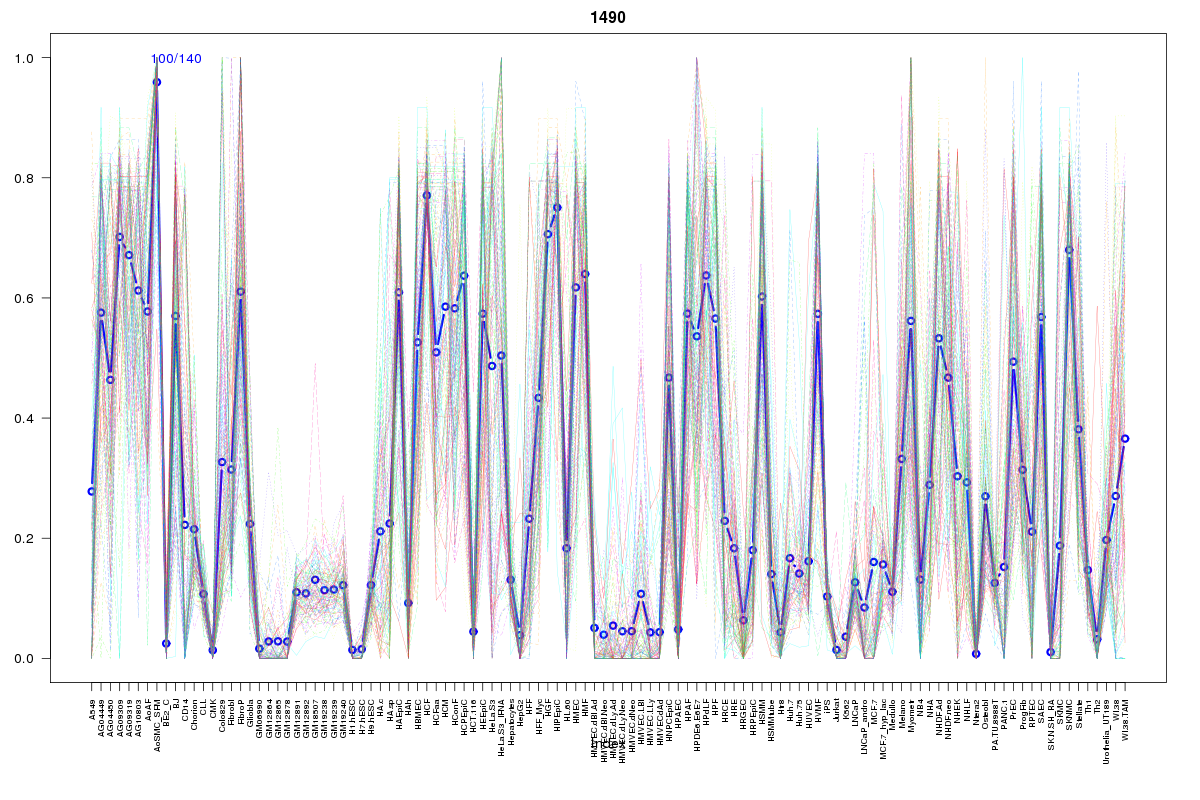 | 1490 | 1 |
 | 2223 | 1 |
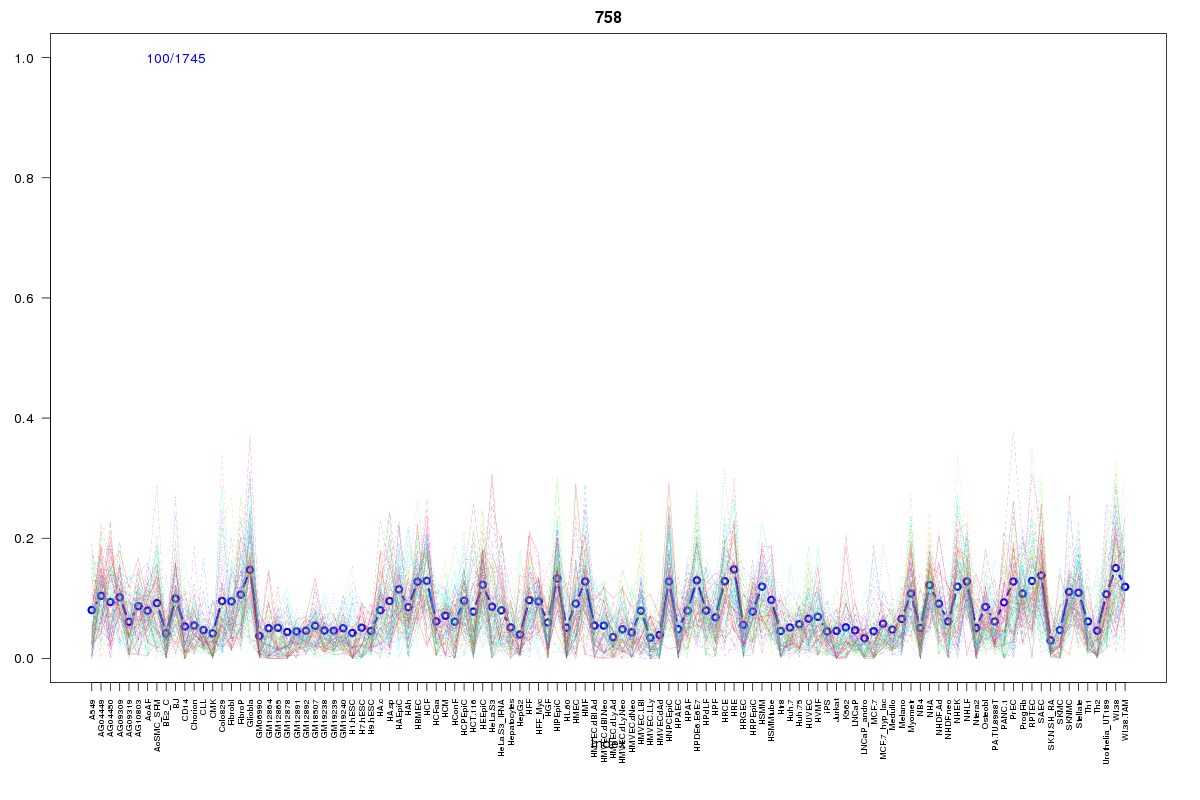 | 758 | 1 |
Resources
BED file downloads
Connects to 37 DHS sitesTop 10 Correlated DHS Sites
p-values indiciate significant higher or lower correlation| Location | Cluster | P-value |
|---|---|---|
| chr10:90647360-90647510 | 15 | 0 |
| chr10:90648020-90648170 | 15 | 0.002 |
| chr10:90649840-90649990 | 265 | 0.003 |
| chr10:90644120-90644270 | 15 | 0.007 |
| chr10:90630040-90630190 | 15 | 0.007 |
| chr10:90649680-90649830 | 367 | 0.008 |
| chr10:90650200-90650350 | 15 | 0.01 |
| chr10:90661860-90662010 | 66 | 0.01 |
| chr10:90660520-90660670 | 15 | 0.01 |
| chr10:90658620-90658770 | 66 | 0.01 |
| chr10:90690840-90690990 | 15 | 0.011 |
External Databases
UCSCEnsembl (ENSG00000234256)