Gene: PABPC1P10
chr3: 155027215-155027596Expression Profile
(log scale)
Graphical Connections
Distribution of linked clusters:
You may find it interesting if many of the connected DHS sites belong to the same cluster.| Cluster Profile | Cluster ID | Number of DHS sites in this cluster |
|---|---|---|
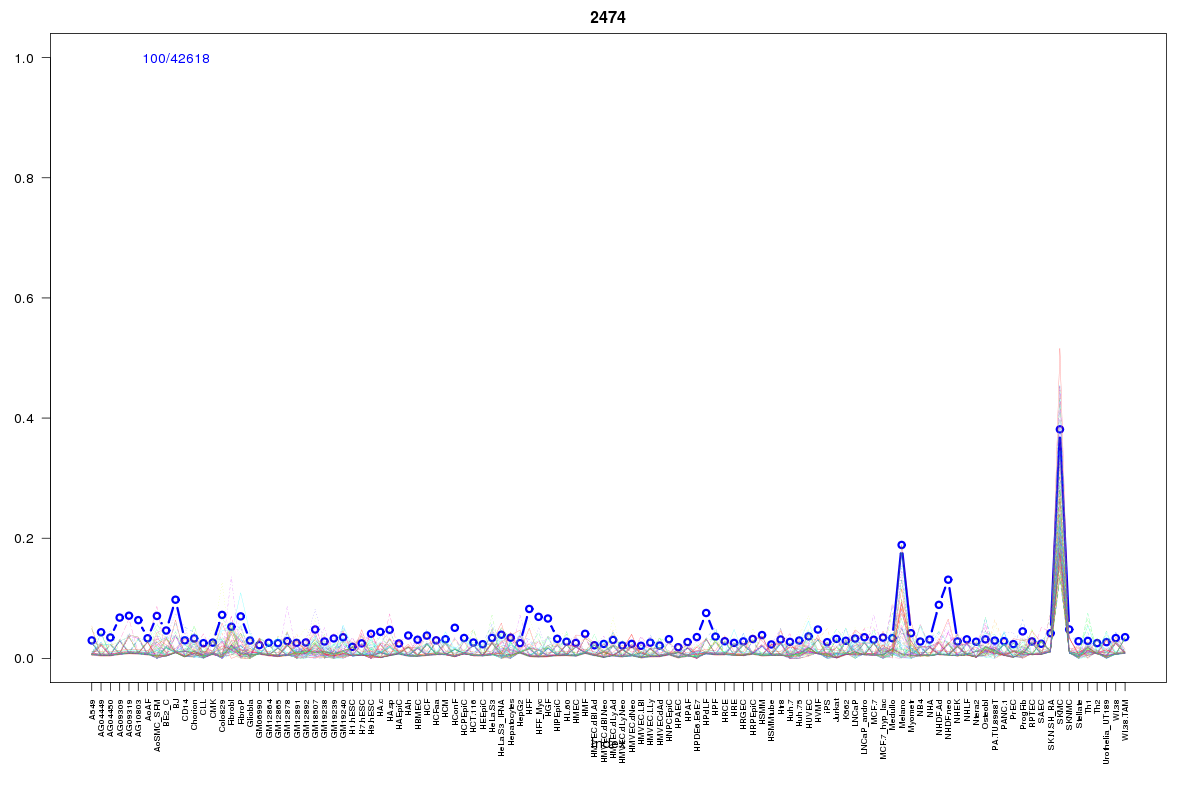 | 2474 | 2 |
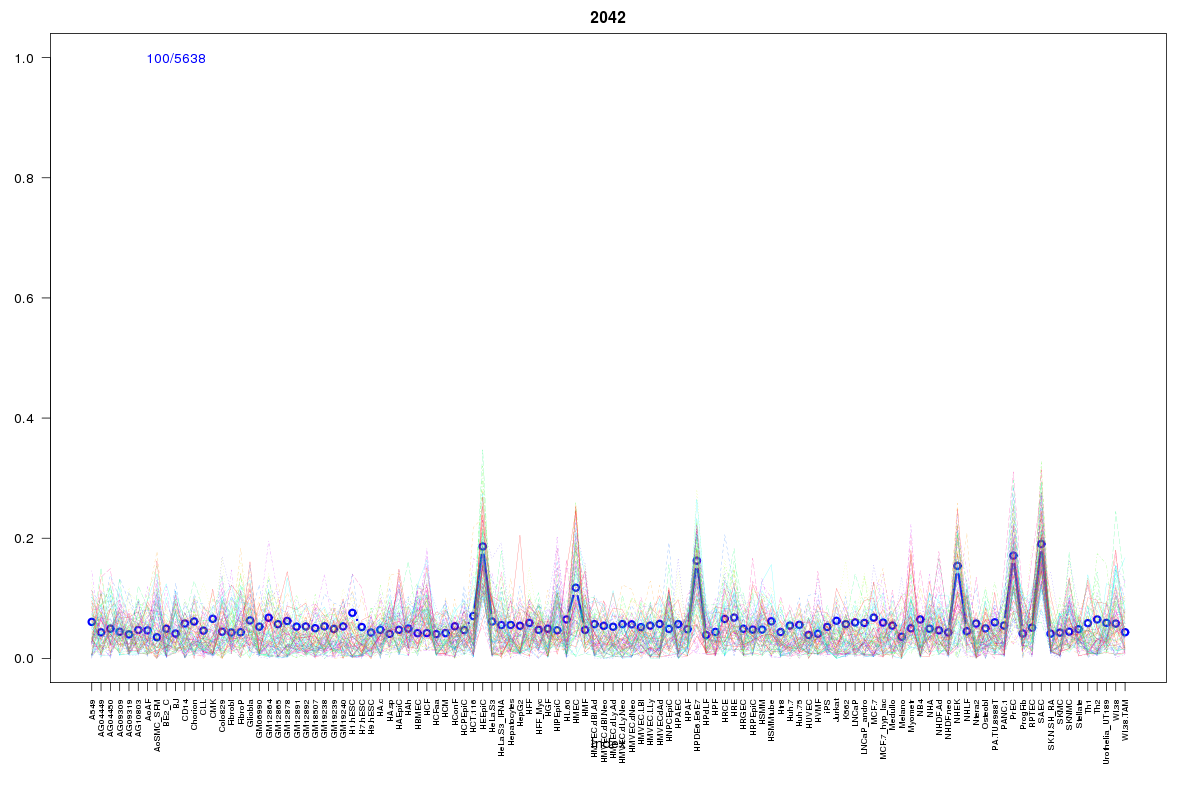 | 2042 | 1 |
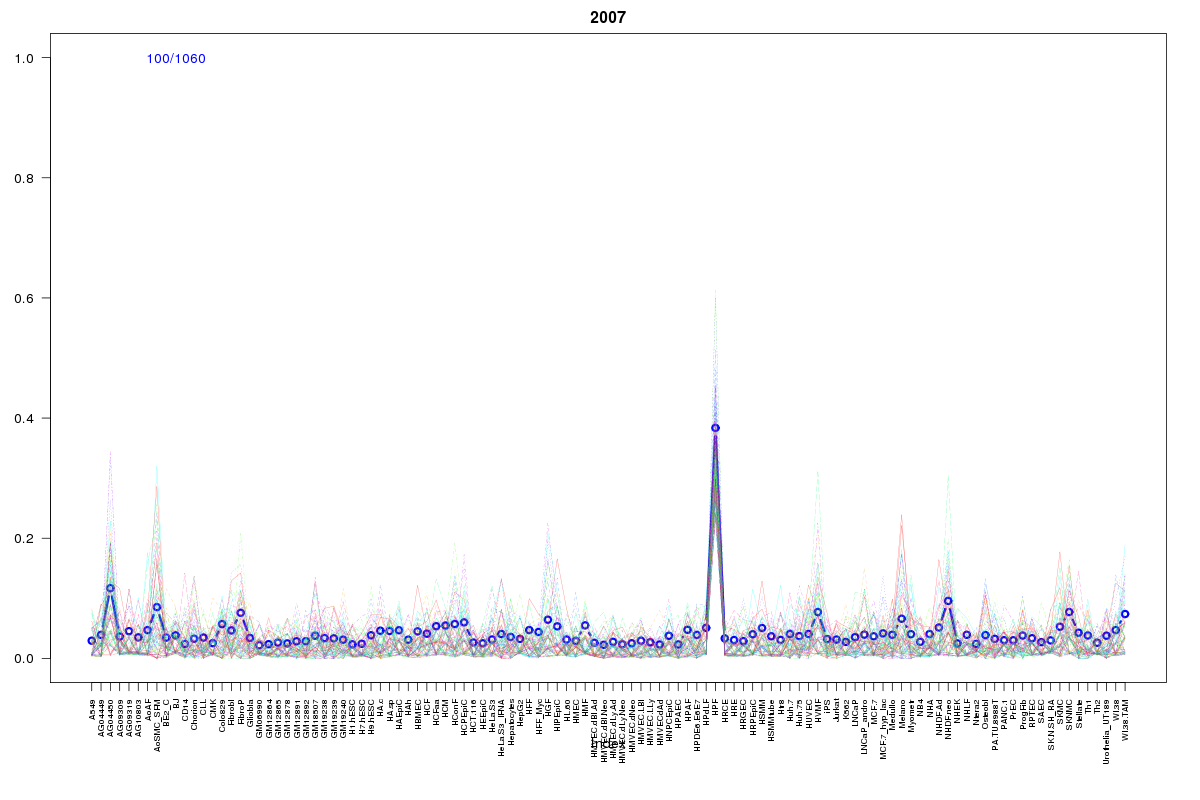 | 2007 | 1 |
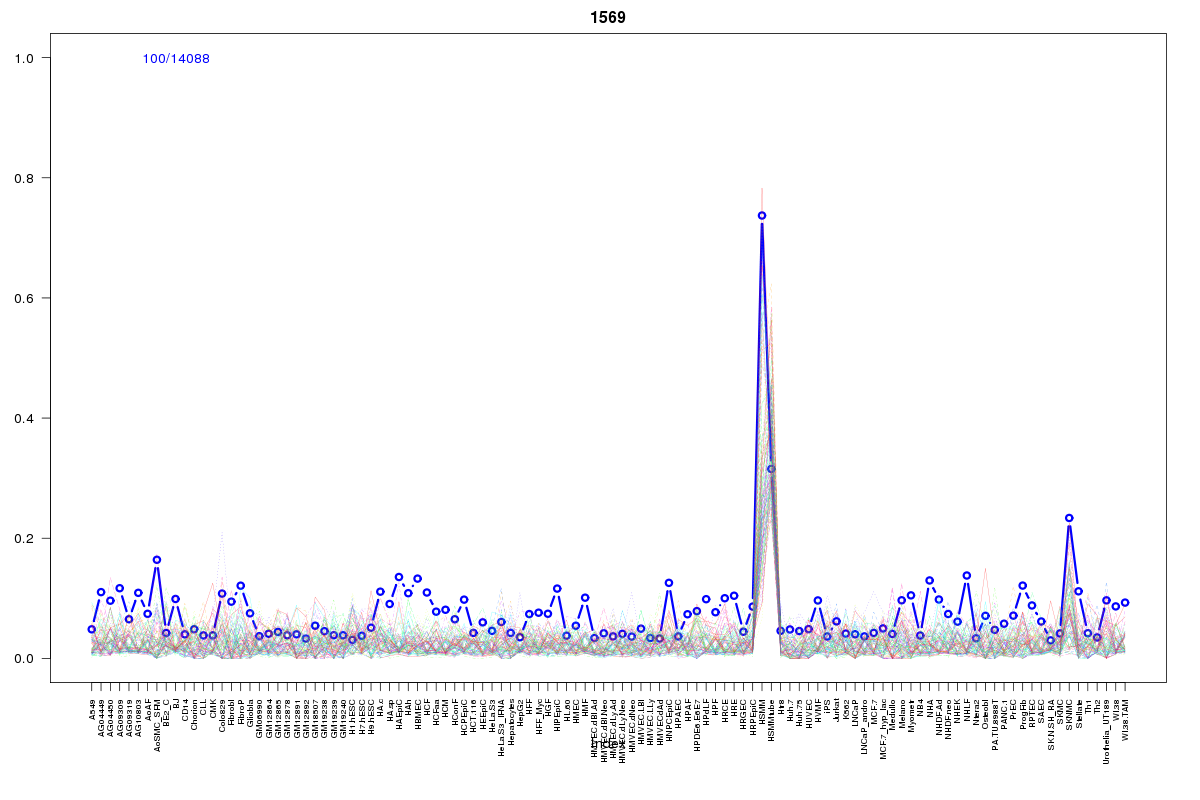 | 1569 | 1 |
Resources
BED file downloads
Connects to 5 DHS sitesTop 10 Correlated DHS Sites
p-values indiciate significant higher or lower correlation| Location | Cluster | P-value |
|---|---|---|
| chr3:155004640-155004790 | 2042 | 0 |
| chr3:155085620-155085770 | 2474 | 0.023 |
| chr3:155104920-155105070 | 2007 | 0.023 |
| chr3:155117540-155117830 | 1569 | 0.023 |
| chr3:155104760-155104910 | 2474 | 0.021 |
External Databases
UCSCEnsembl (ENSG00000239443)