Gene: ATP5G1P3
chr3: 138608096-138608799Expression Profile
(log scale)
Graphical Connections
Distribution of linked clusters:
You may find it interesting if many of the connected DHS sites belong to the same cluster.| Cluster Profile | Cluster ID | Number of DHS sites in this cluster |
|---|---|---|
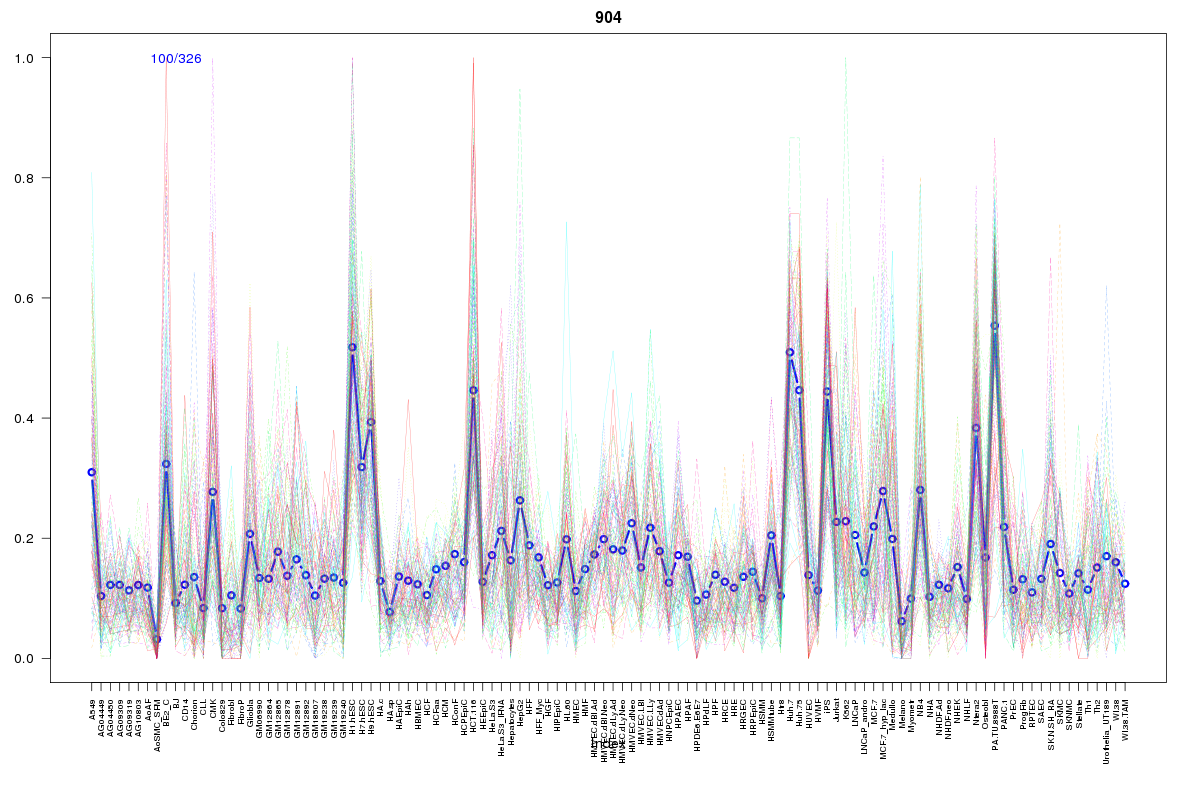 | 904 | 1 |
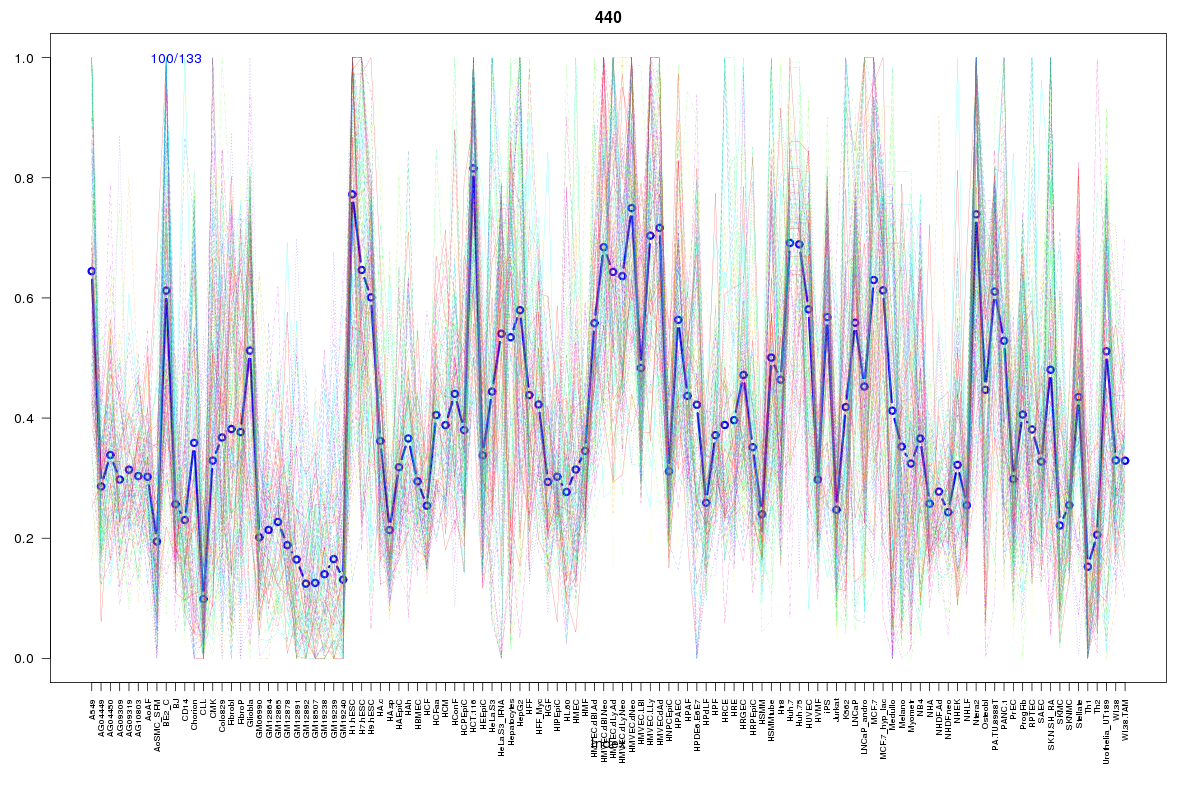 | 440 | 1 |
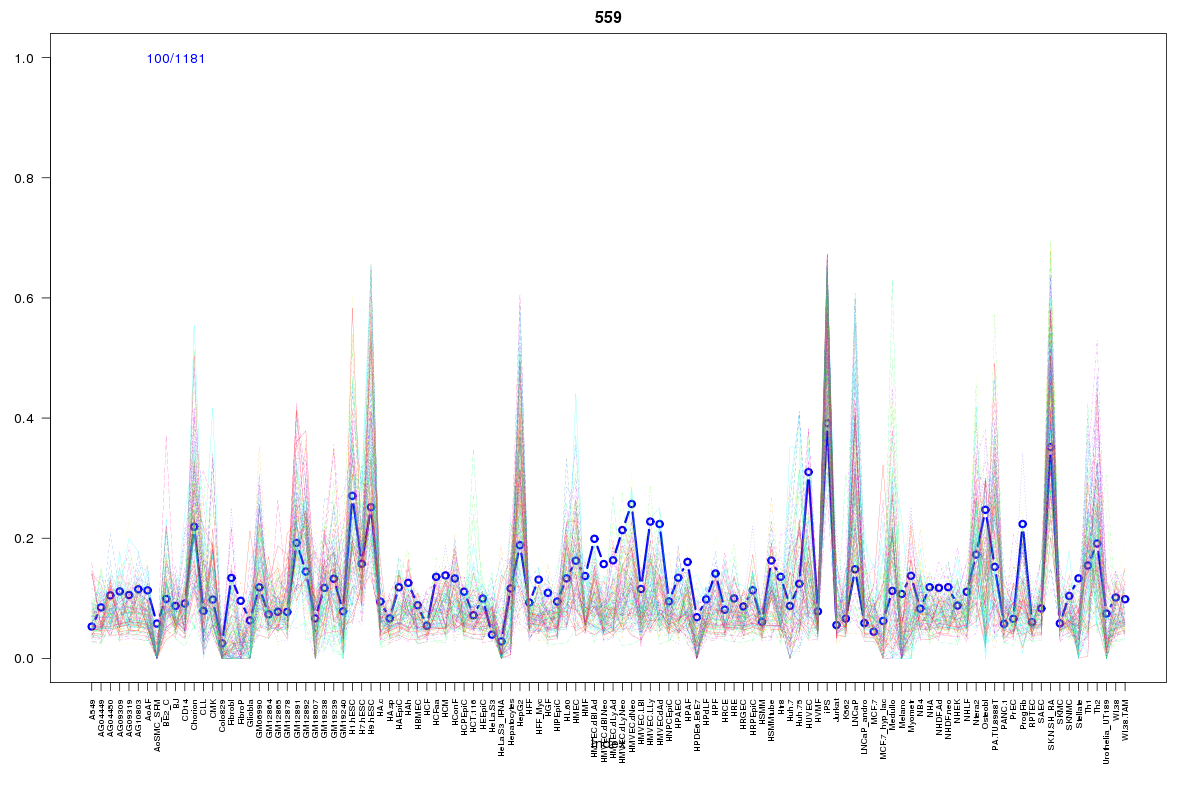 | 559 | 1 |
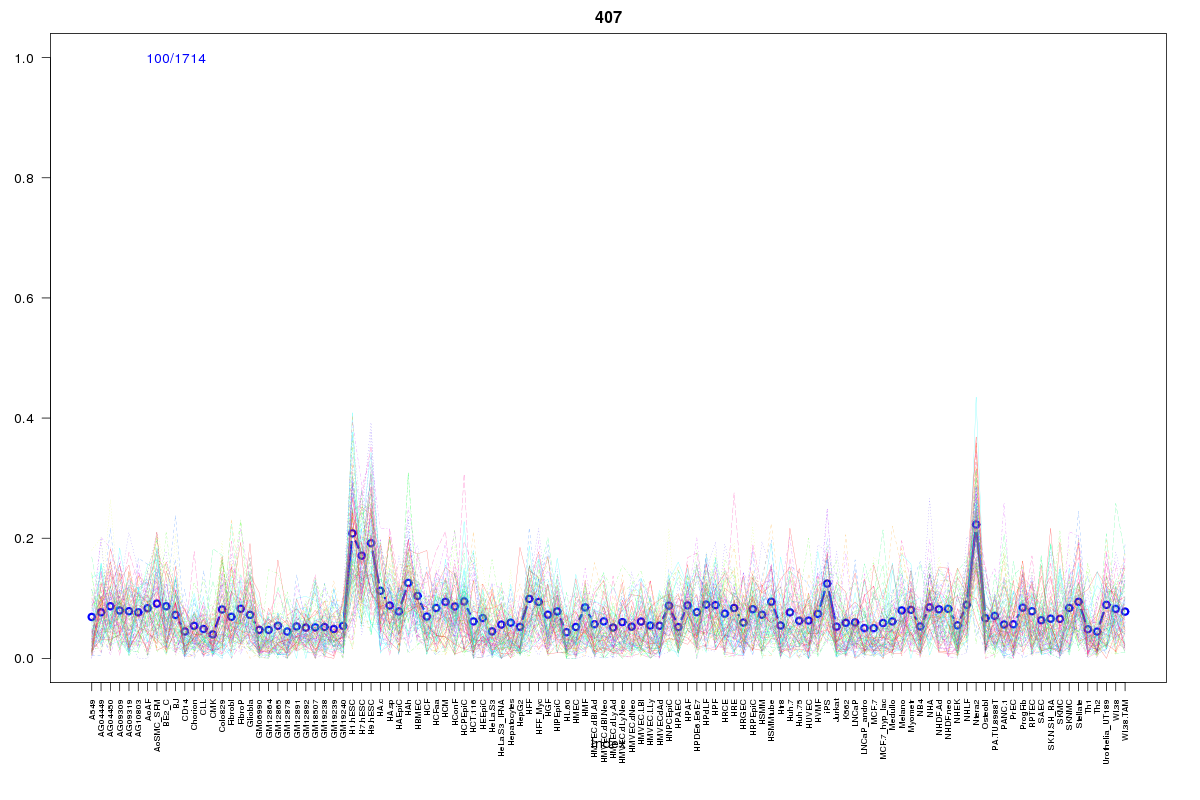 | 407 | 1 |
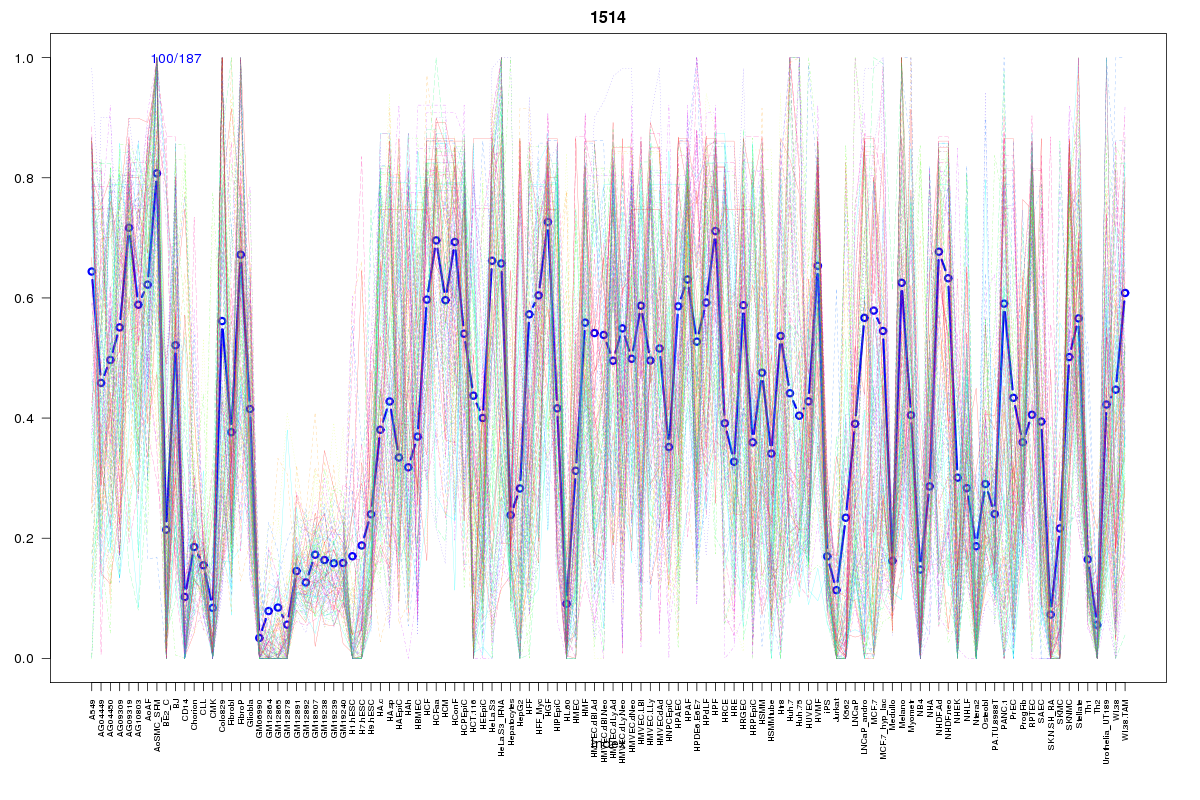 | 1514 | 1 |
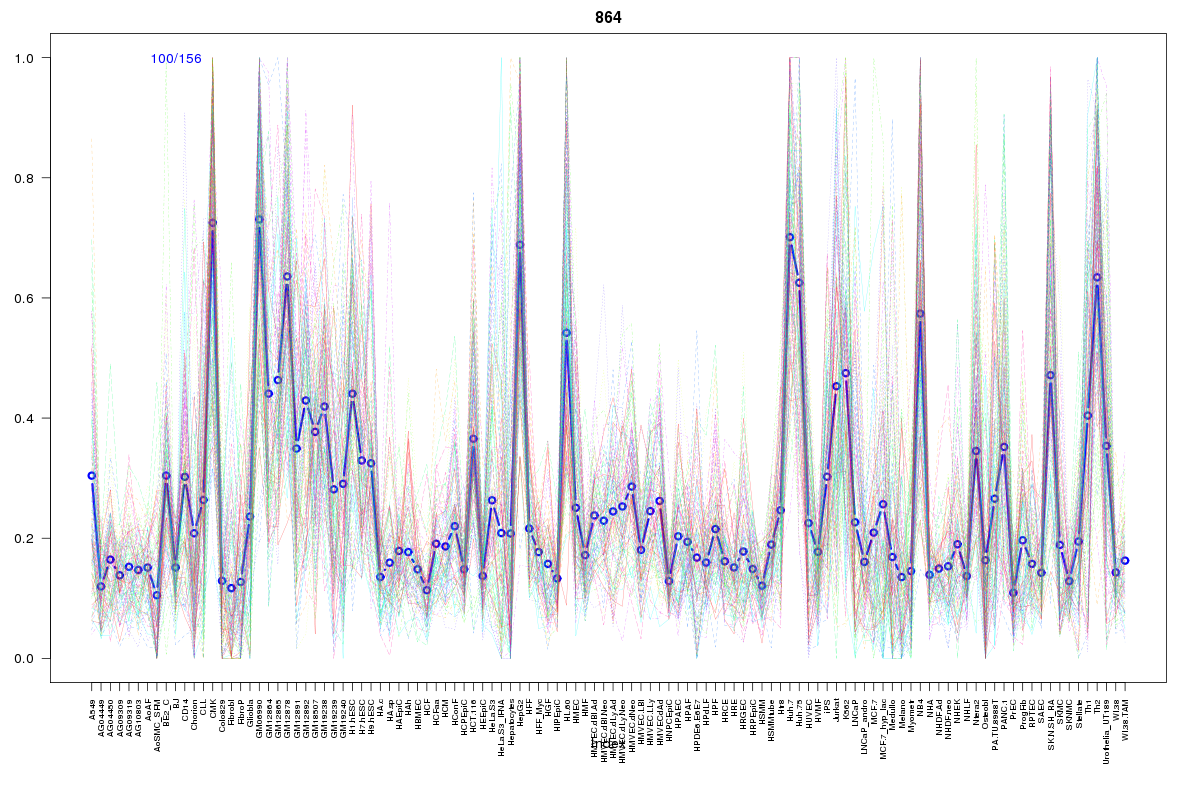 | 864 | 1 |
 | 520 | 1 |
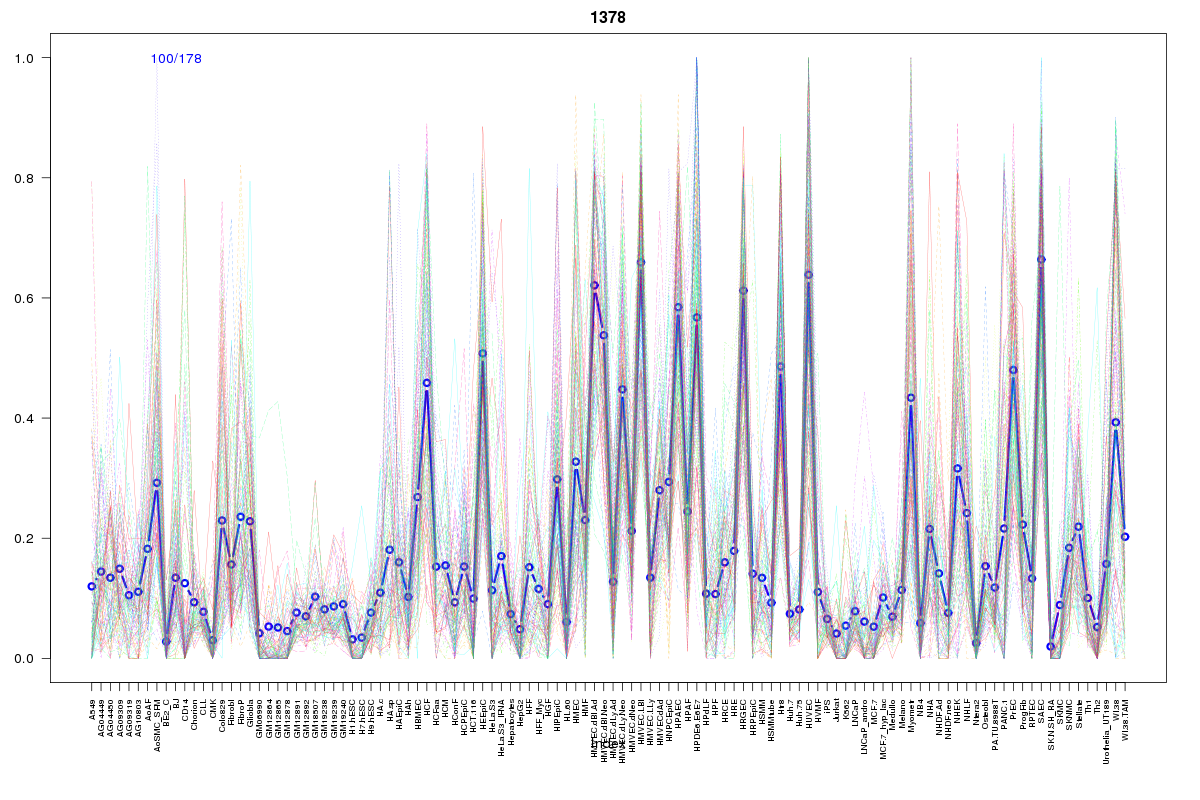 | 1378 | 1 |
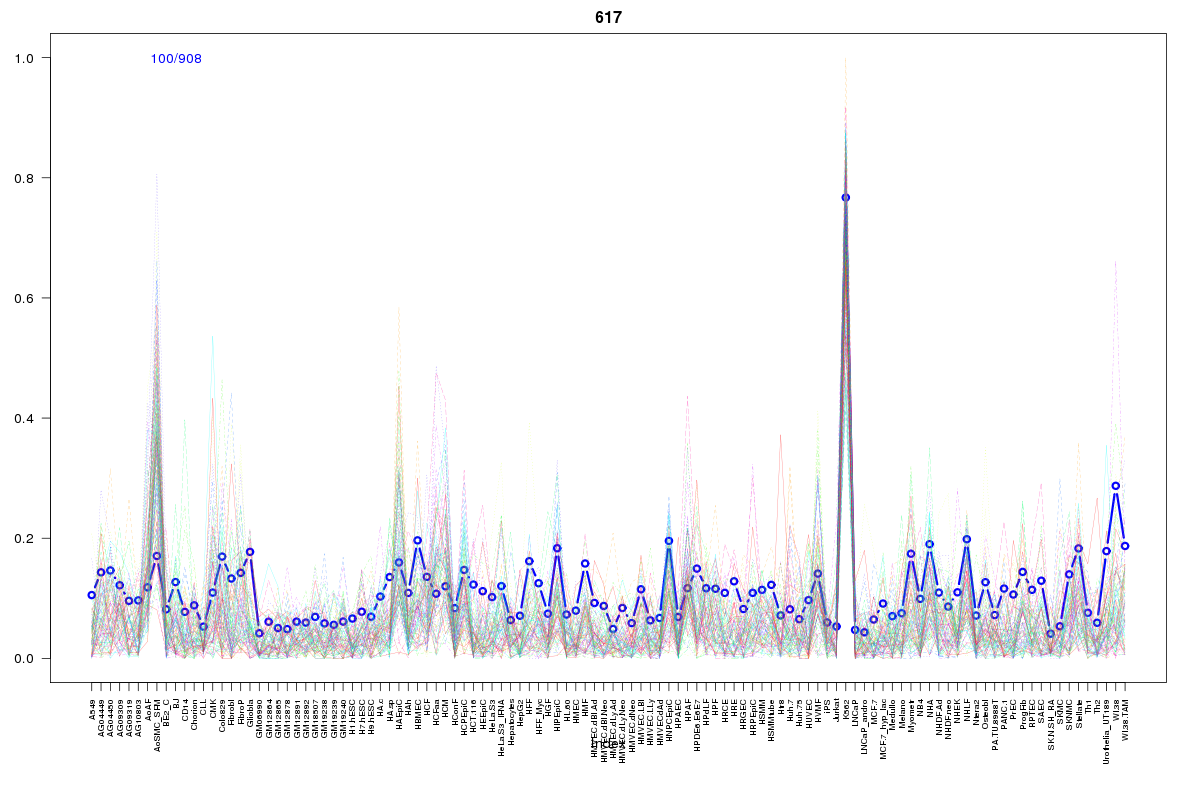 | 617 | 1 |
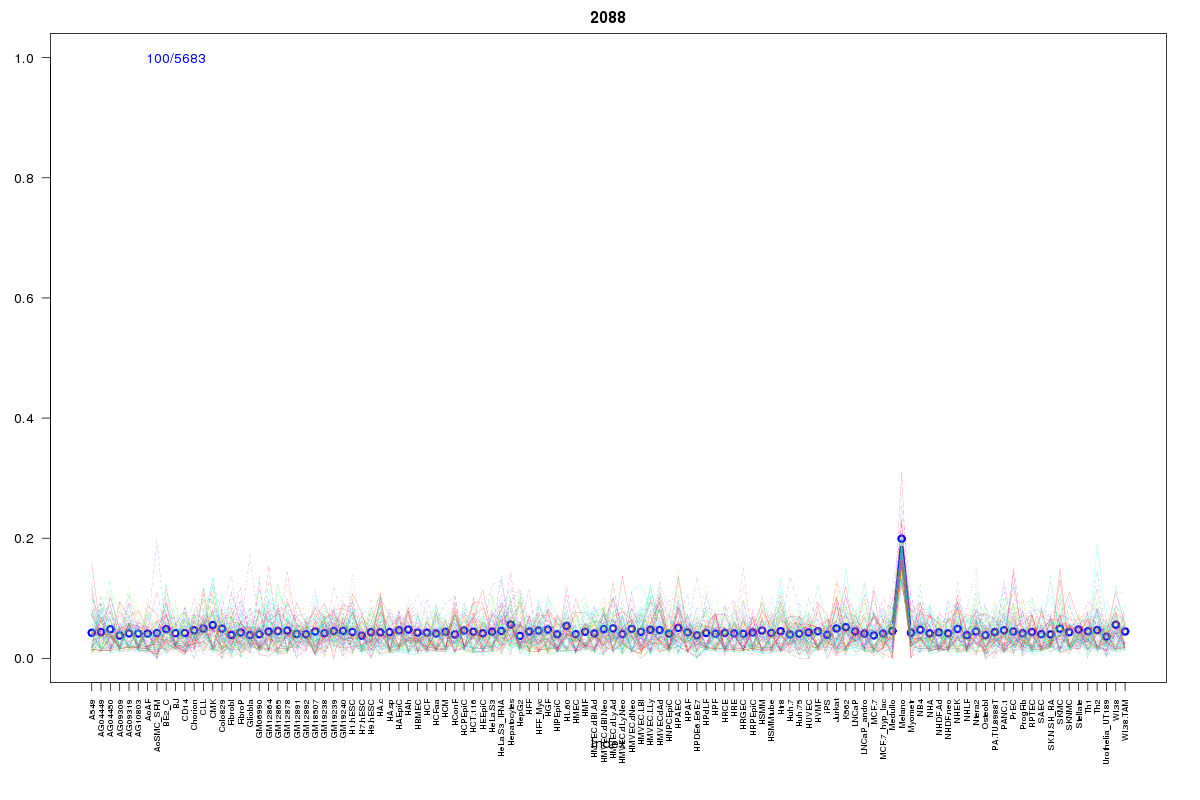 | 2088 | 1 |
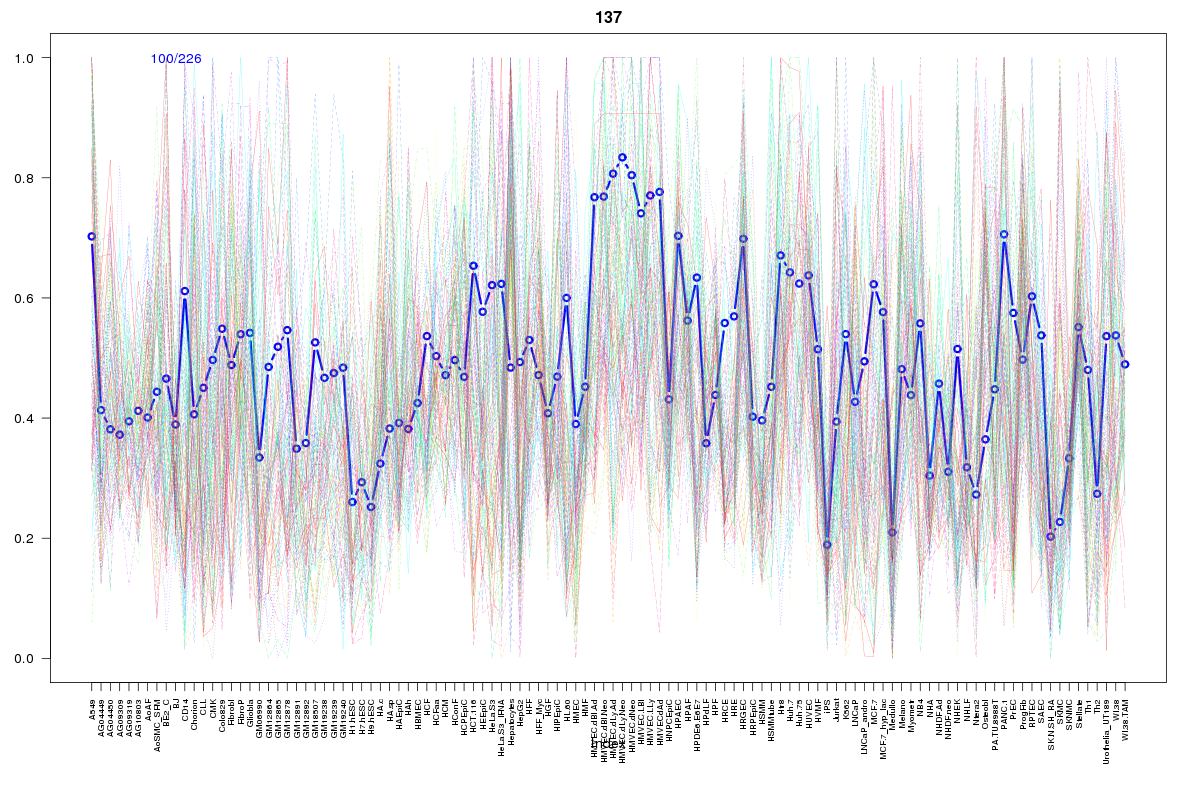 | 137 | 1 |
Resources
BED file downloads
Connects to 11 DHS sitesTop 10 Correlated DHS Sites
p-values indiciate significant higher or lower correlation| Location | Cluster | P-value |
|---|---|---|
| chr3:138554105-138554255 | 520 | 0.01 |
| chr3:138618205-138618355 | 2088 | 0.01 |
| chr3:138617505-138617655 | 617 | 0.018 |
| chr3:138668345-138668495 | 407 | 0.019 |
| chr3:138654645-138654795 | 904 | 0.023 |
| chr3:138634080-138634230 | 137 | 0.017 |
| chr3:138664445-138664595 | 559 | 0.017 |
| chr3:138610200-138610350 | 1378 | 0.016 |
| chr3:138553145-138553295 | 864 | 0.014 |
| chr3:138698640-138698790 | 1514 | 0.01 |
| chr3:138660280-138660430 | 440 | 0.003 |
External Databases
UCSCEnsembl (ENSG00000242244)