Gene: Y_RNA
chr3: 41910489-41910587Expression Profile
(log scale)
Graphical Connections
Distribution of linked clusters:
You may find it interesting if many of the connected DHS sites belong to the same cluster.| Cluster Profile | Cluster ID | Number of DHS sites in this cluster |
|---|---|---|
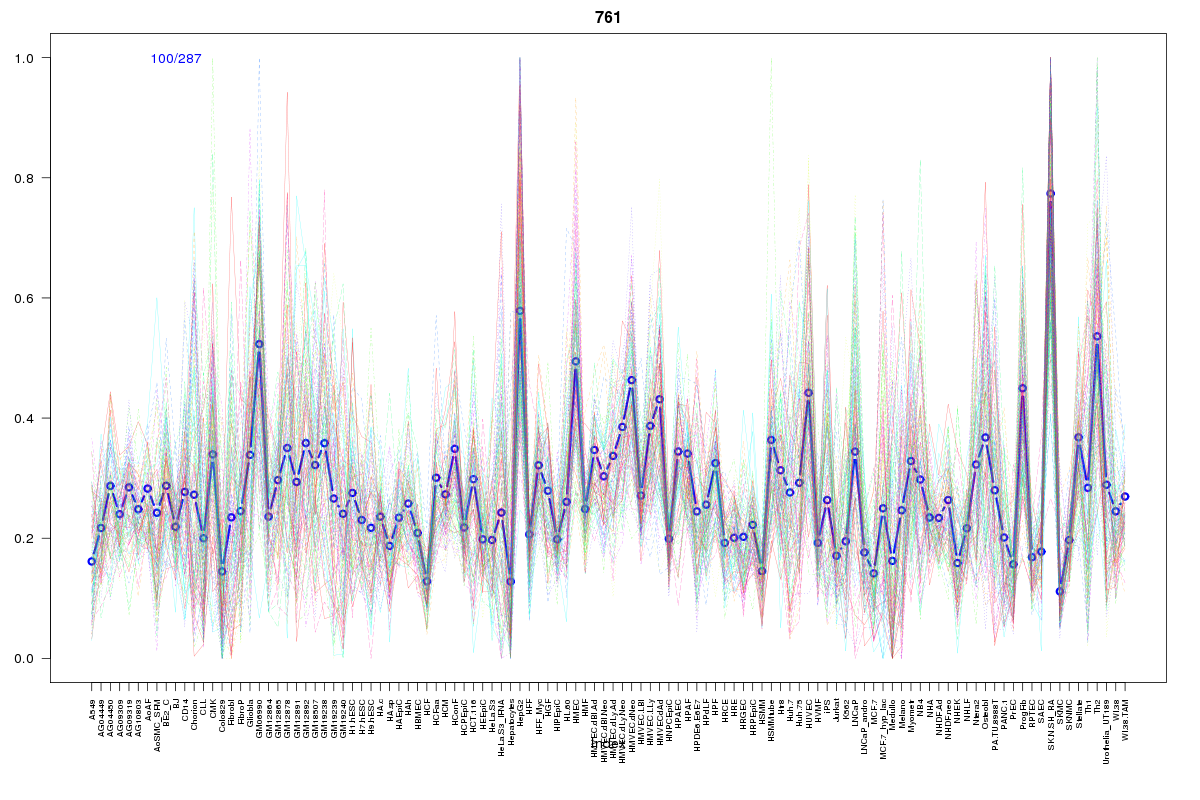 | 761 | 1 |
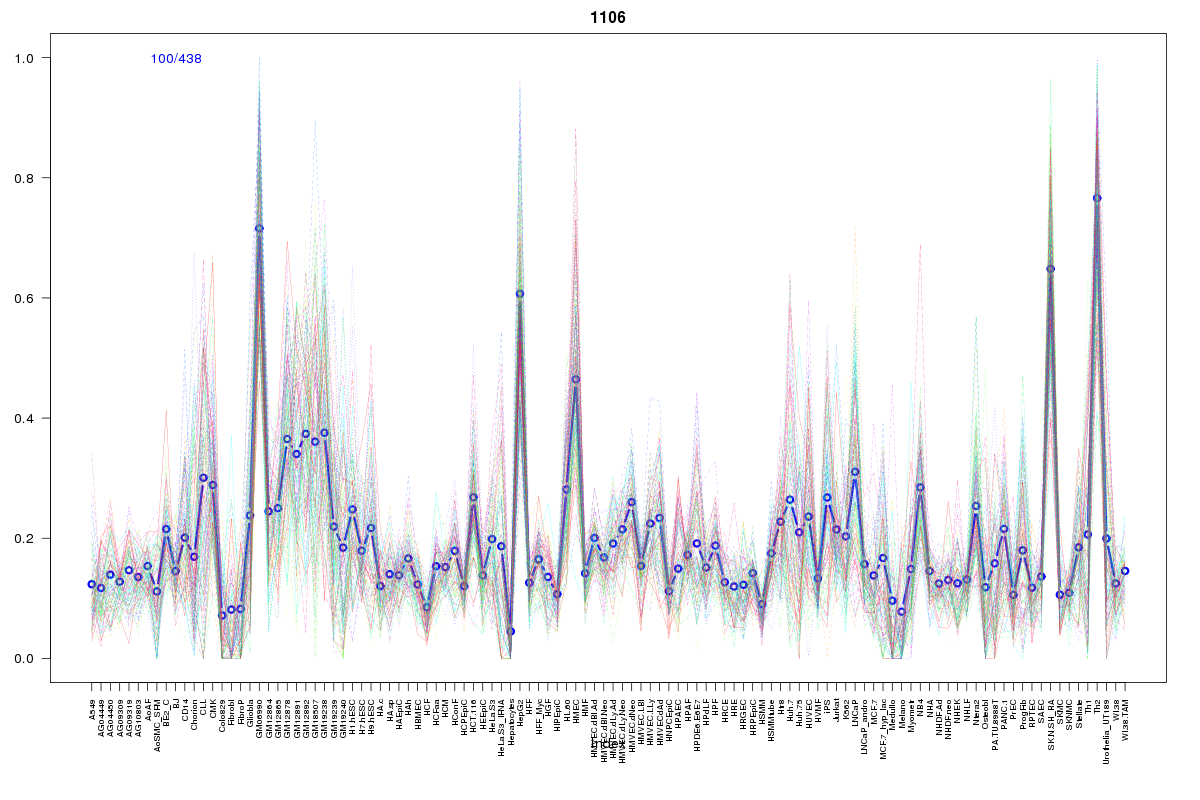 | 1106 | 1 |
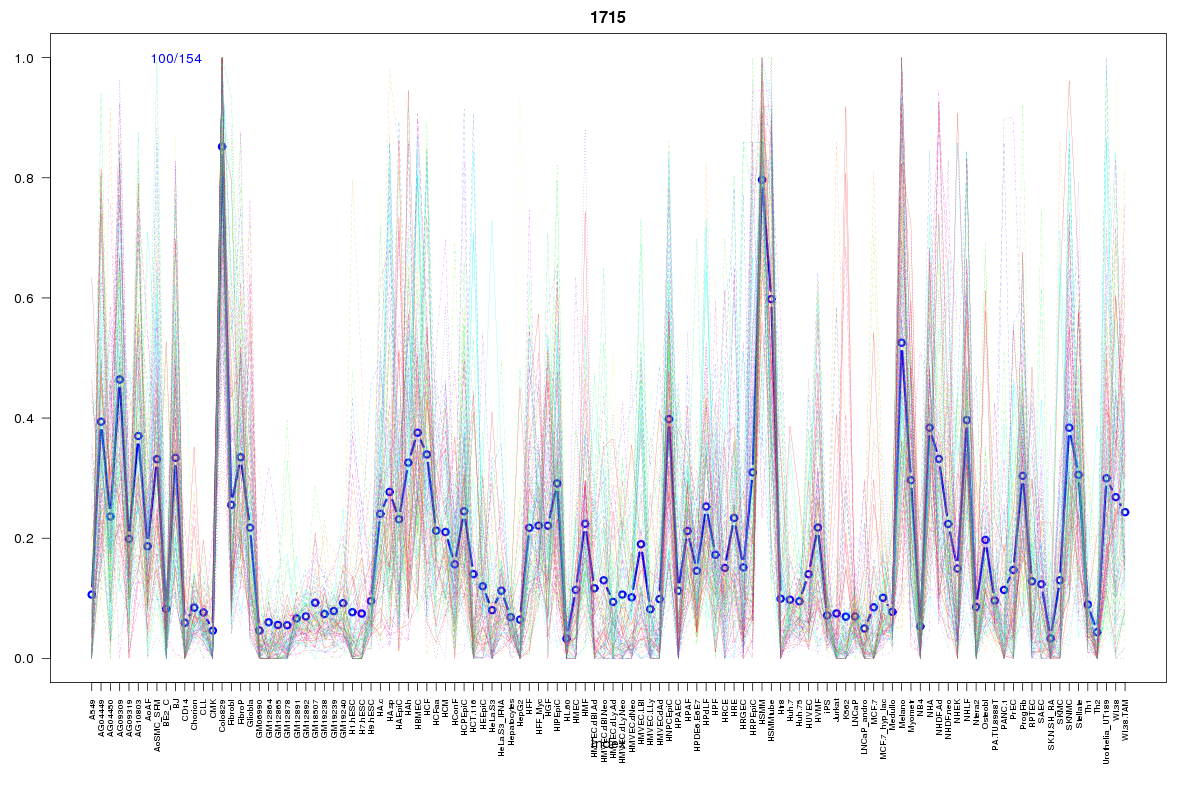 | 1715 | 1 |
 | 860 | 1 |
 | 626 | 1 |
 | 1605 | 1 |
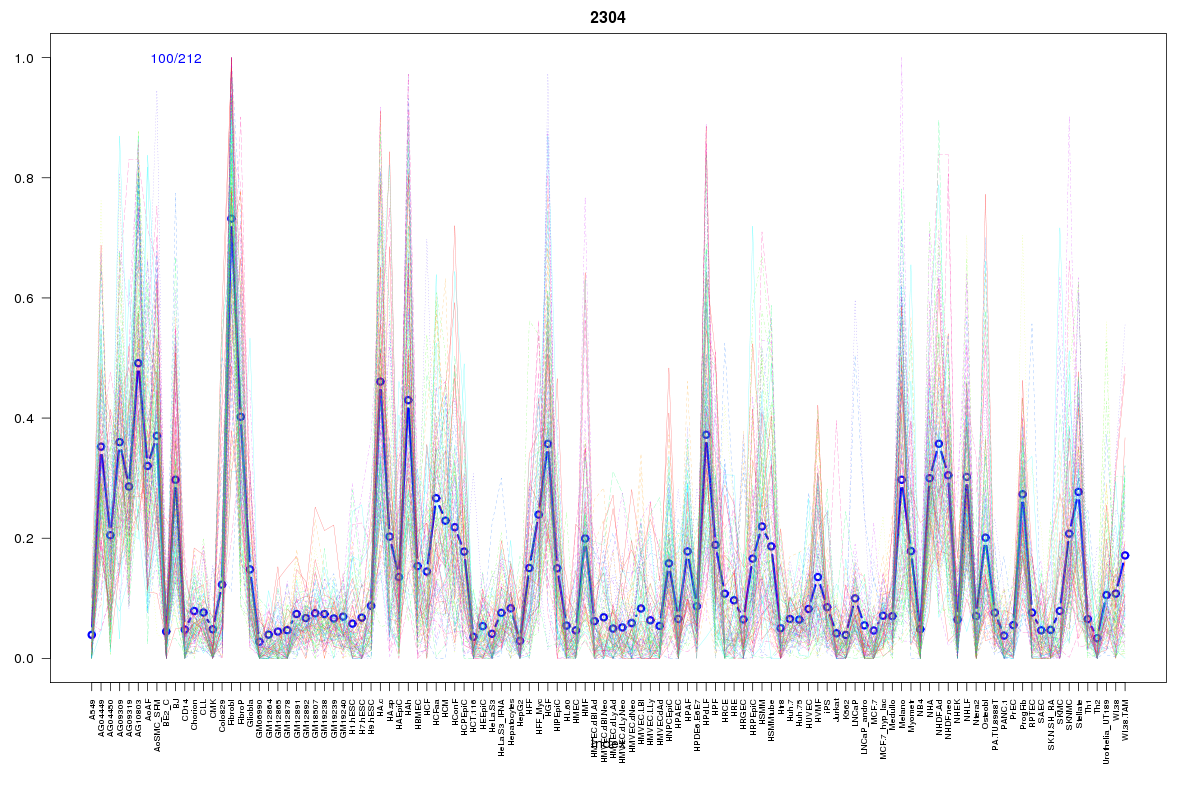 | 2304 | 1 |
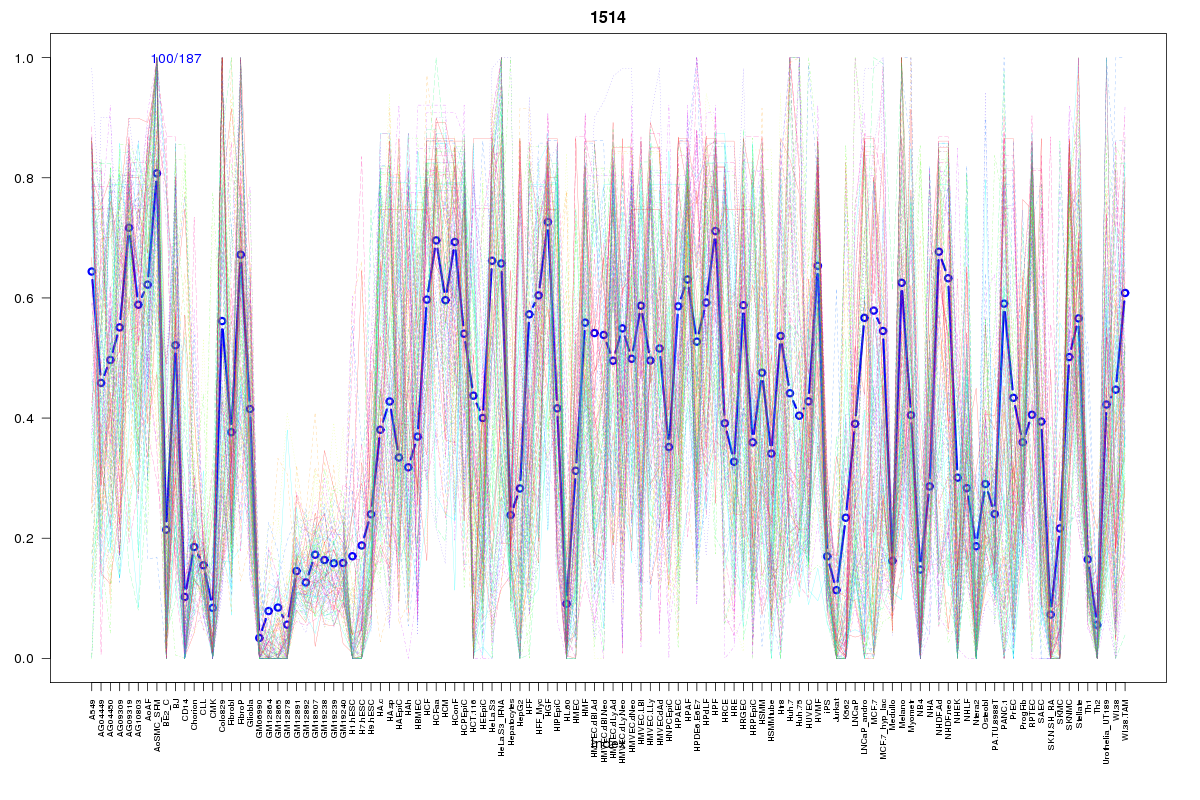 | 1514 | 1 |
Resources
BED file downloads
Connects to 8 DHS sitesTop 10 Correlated DHS Sites
p-values indiciate significant higher or lower correlation| Location | Cluster | P-value |
|---|---|---|
| chr3:41910800-41910950 | 626 | 0 |
| chr3:41960505-41960655 | 1605 | 0.017 |
| chr3:41887805-41887955 | 860 | 0.02 |
| chr3:42003020-42003170 | 761 | 0.023 |
| chr3:41849740-41849890 | 1715 | 0.022 |
| chr3:41974725-41974875 | 2304 | 0.021 |
| chr3:42003285-42003435 | 1106 | 0.019 |
| chr3:41974900-41975050 | 1514 | 0.009 |
External Databases
UCSCEnsembl (ENSG00000251986)