Gene: MYOG
chr1: 203052259-203055164Expression Profile
(log scale)
Graphical Connections
Distribution of linked clusters:
You may find it interesting if many of the connected DHS sites belong to the same cluster.| Cluster Profile | Cluster ID | Number of DHS sites in this cluster |
|---|---|---|
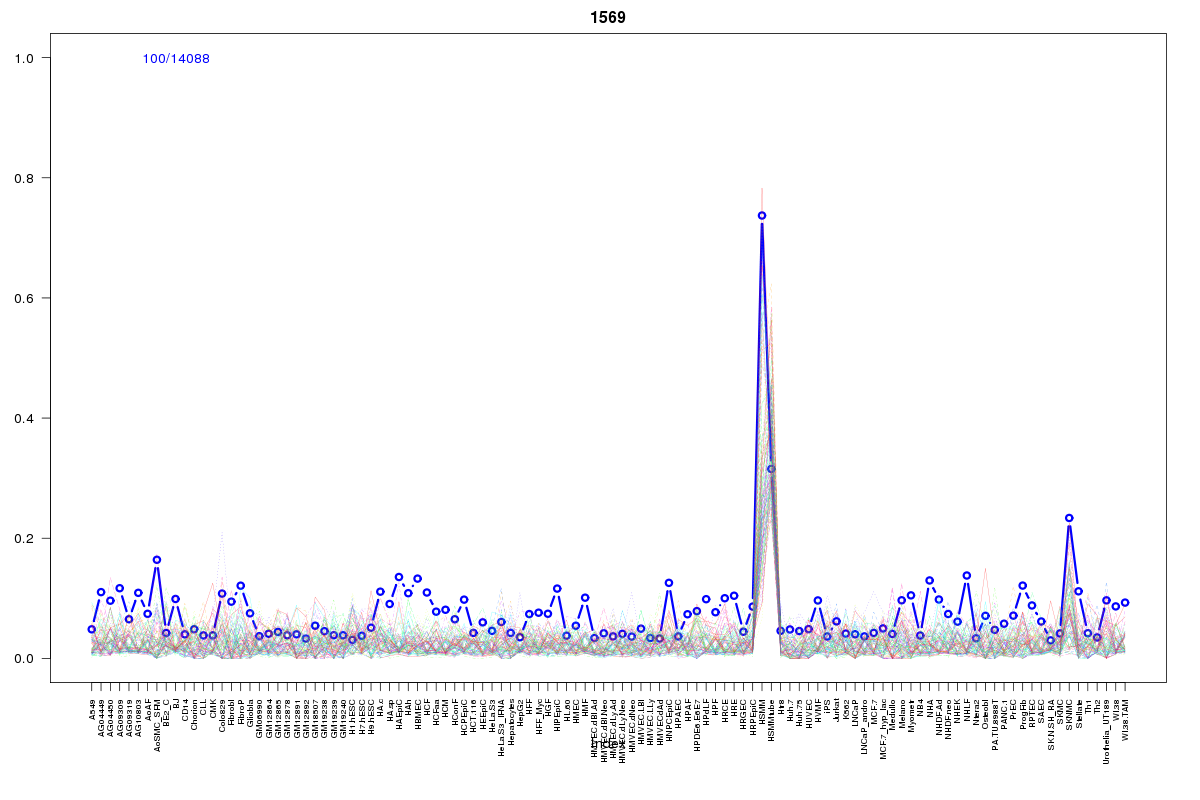 | 1569 | 17 |
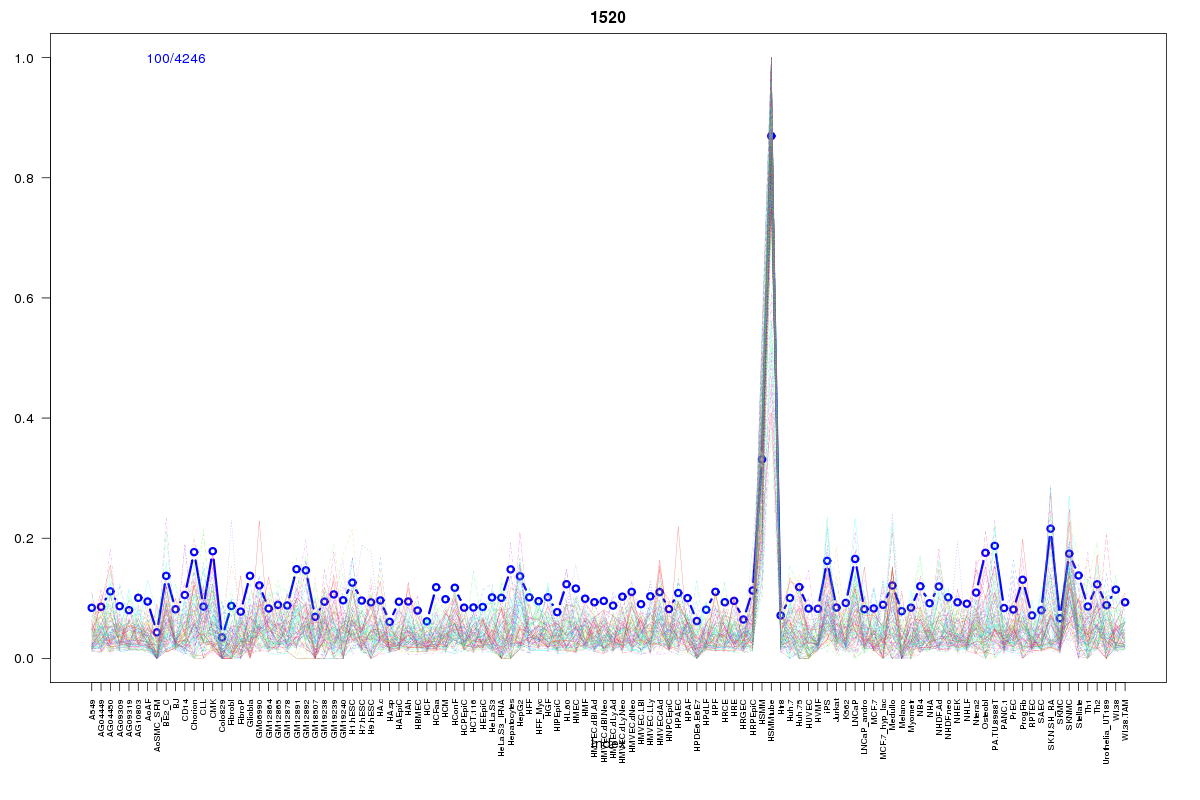 | 1520 | 10 |
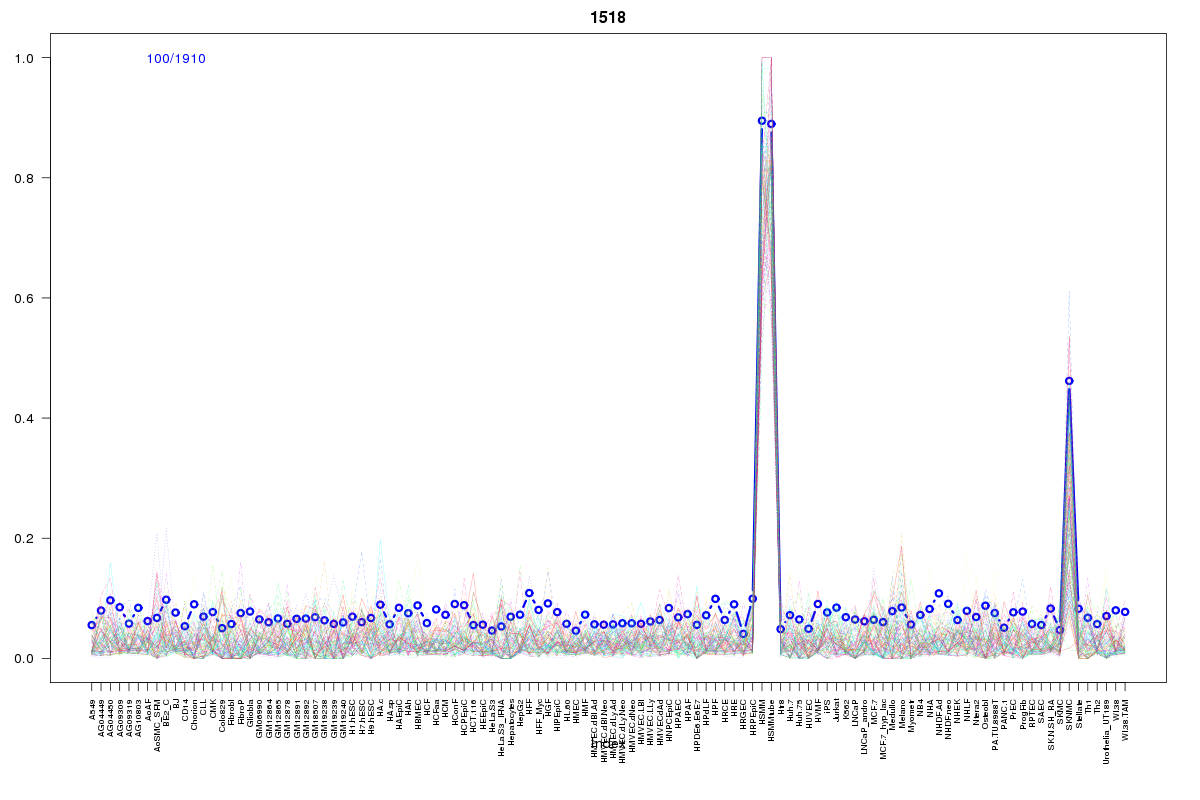 | 1518 | 7 |
 | 1721 | 7 |
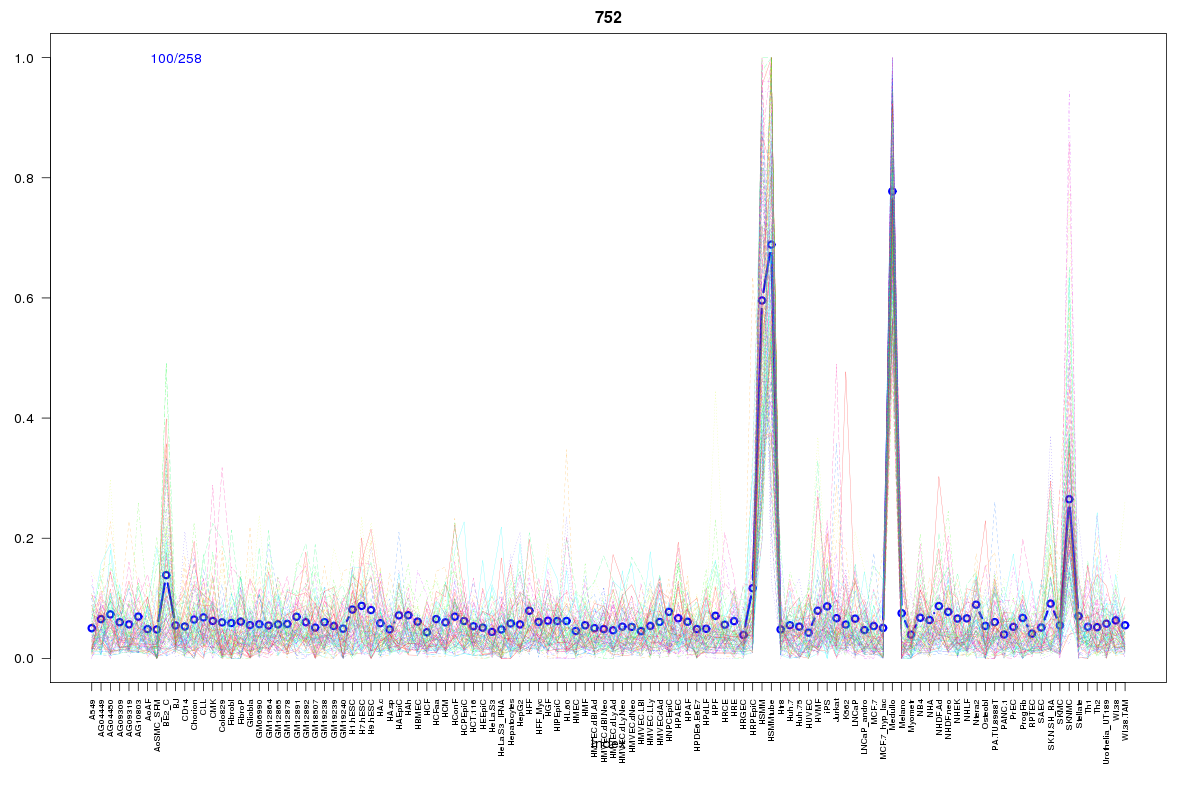 | 752 | 4 |
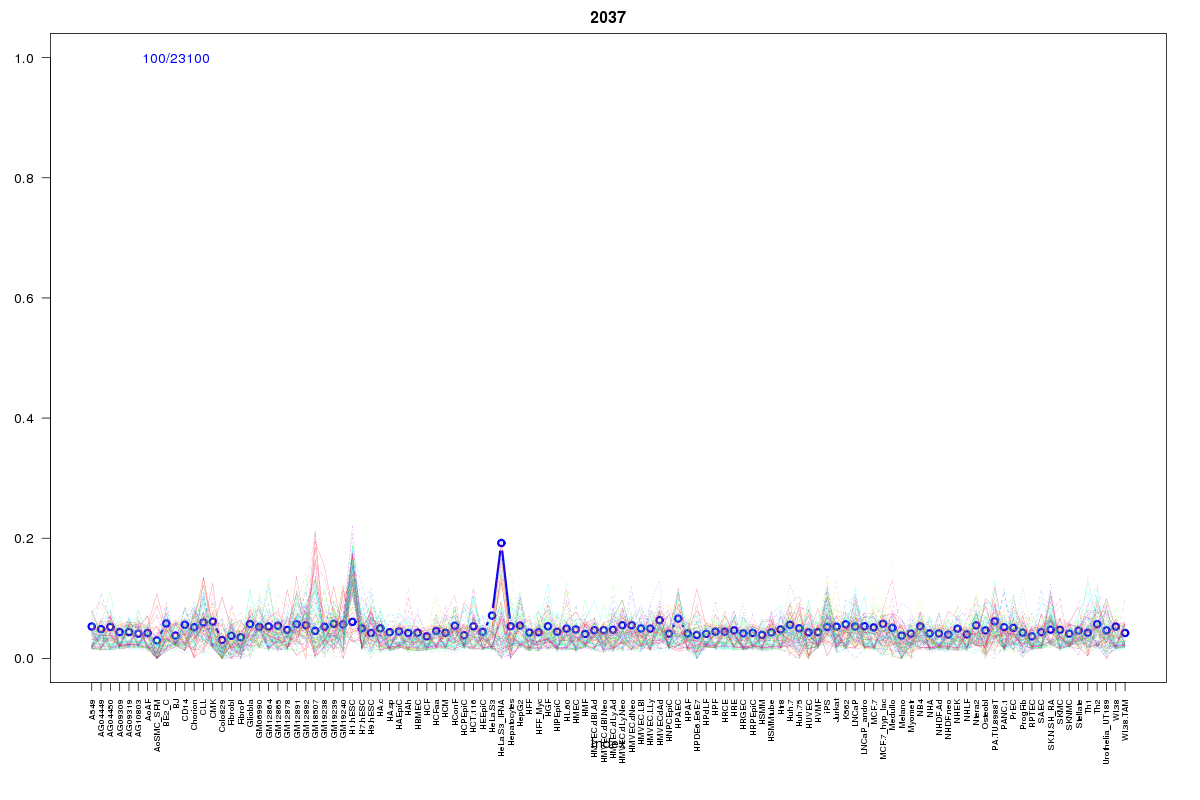 | 2037 | 3 |
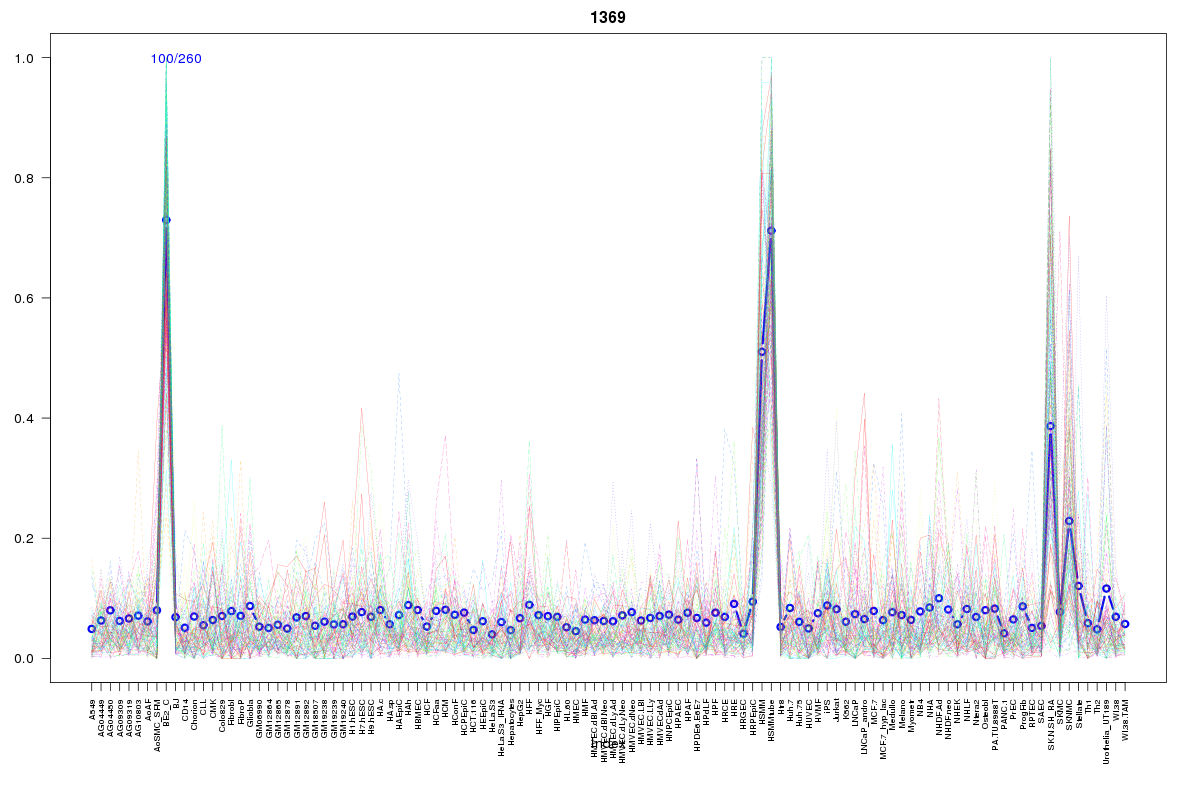 | 1369 | 2 |
 | 2055 | 2 |
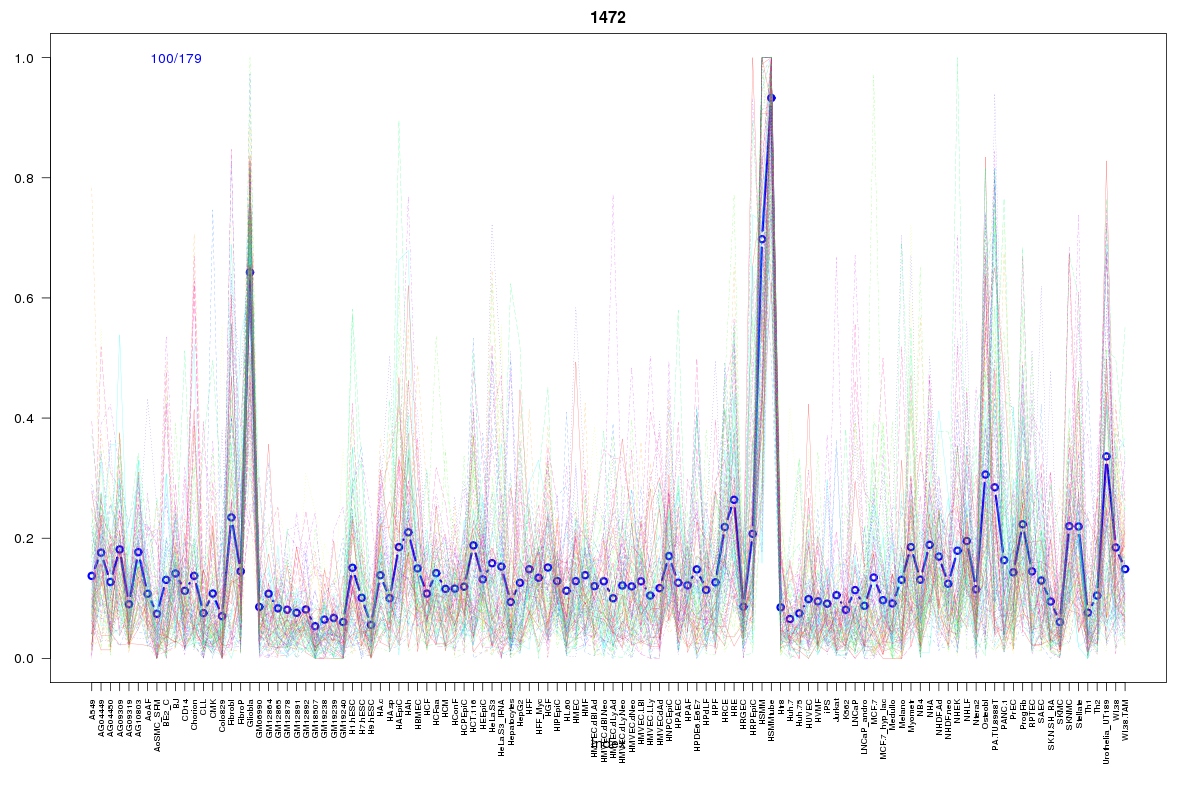 | 1472 | 1 |
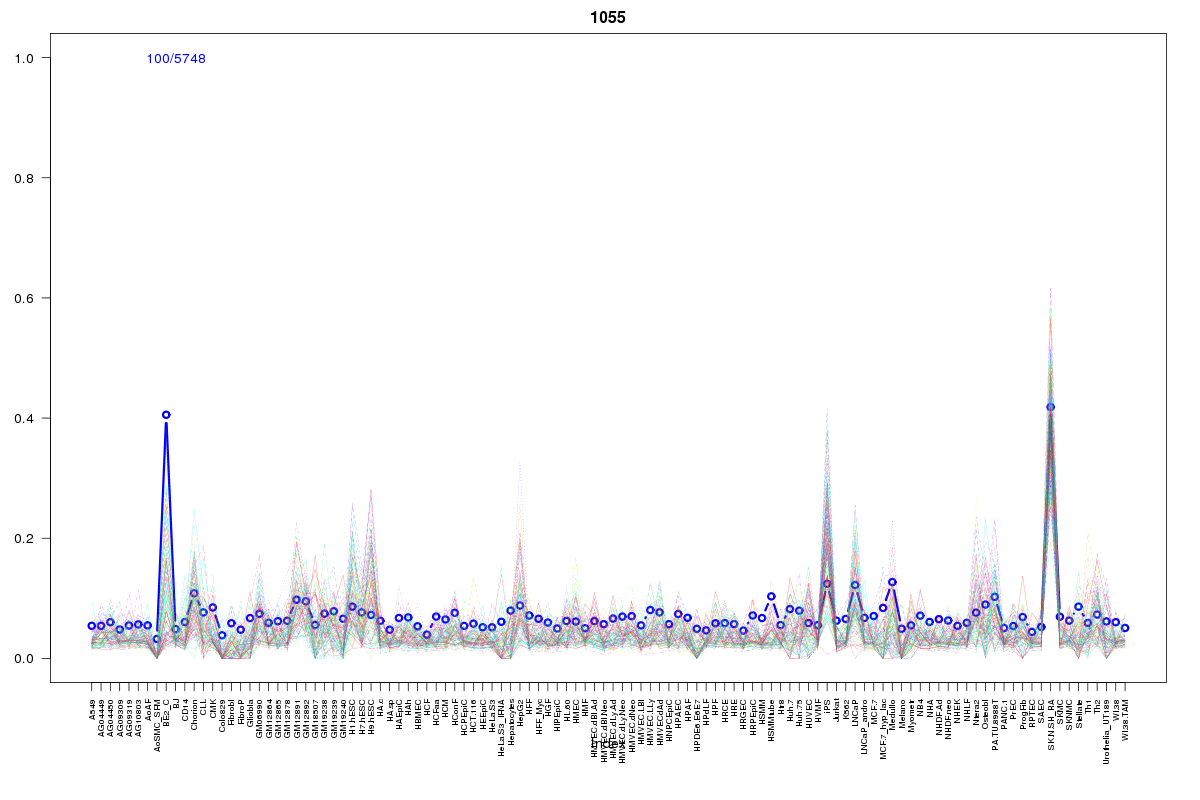 | 1055 | 1 |
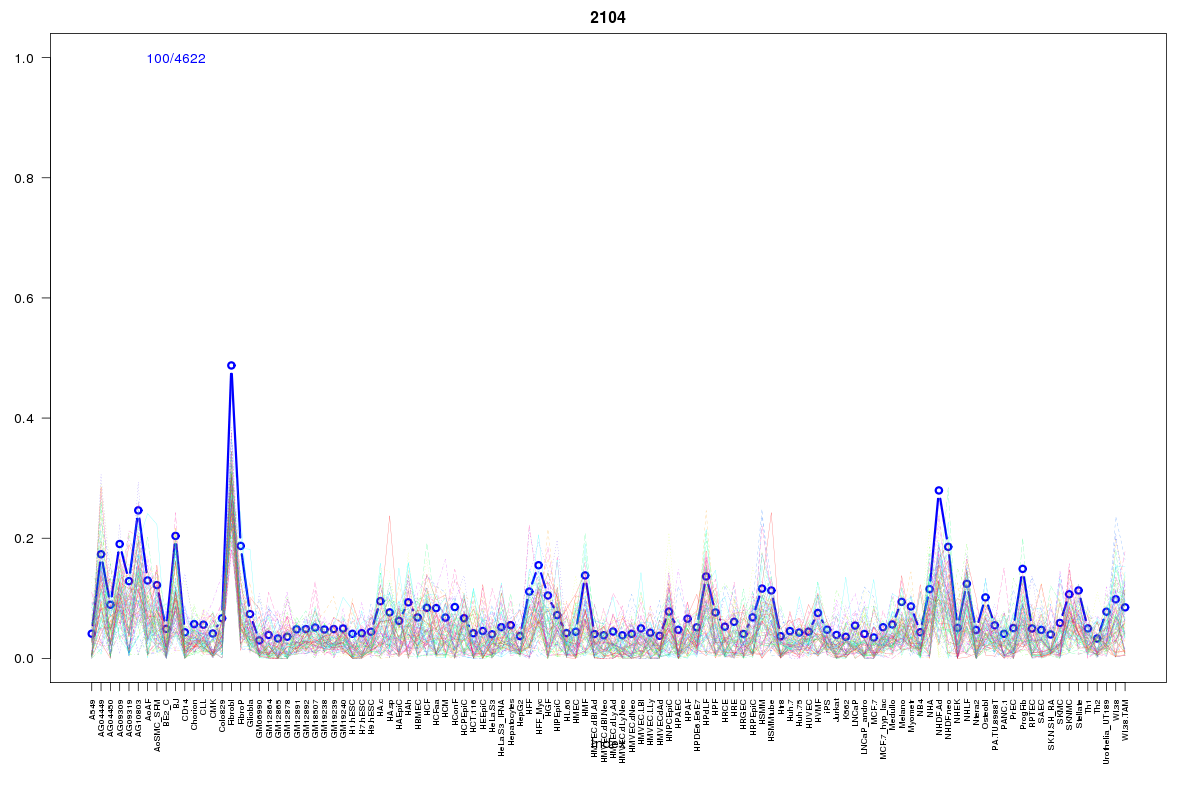 | 2104 | 1 |
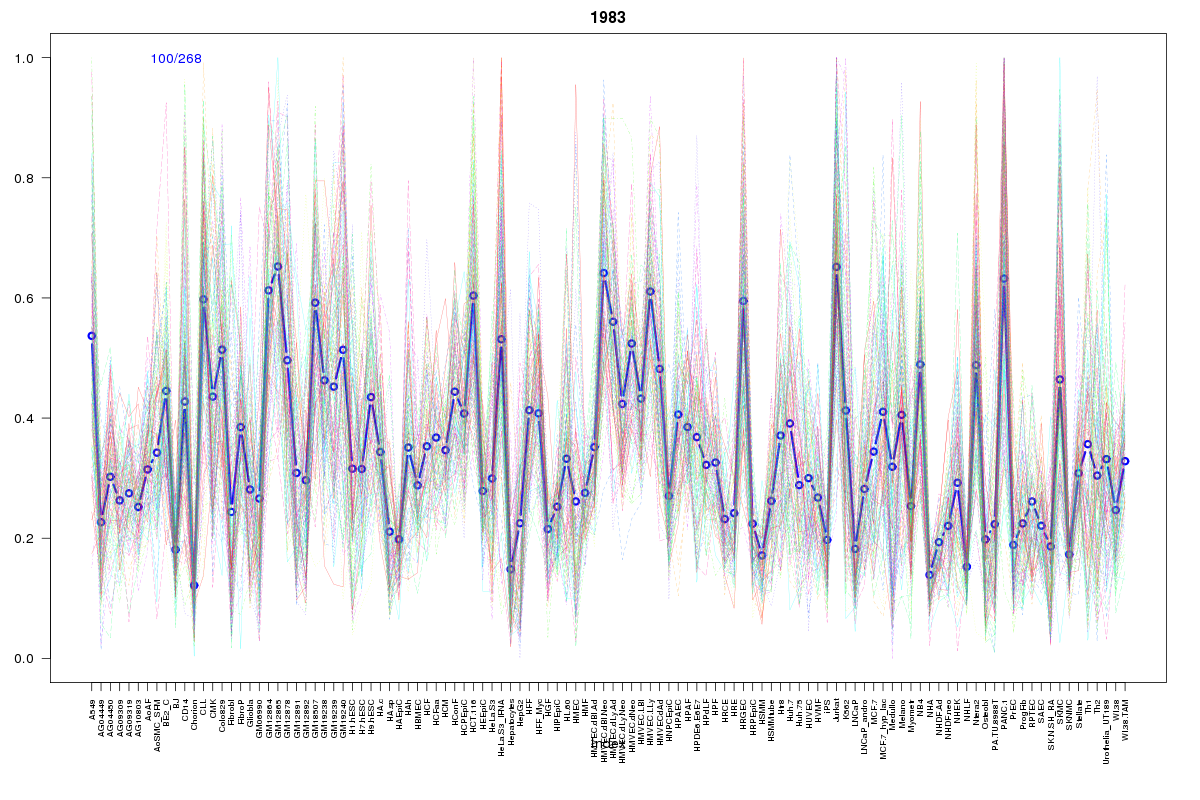 | 1983 | 1 |
 | 1056 | 1 |
 | 2075 | 1 |
 | 10 | 1 |
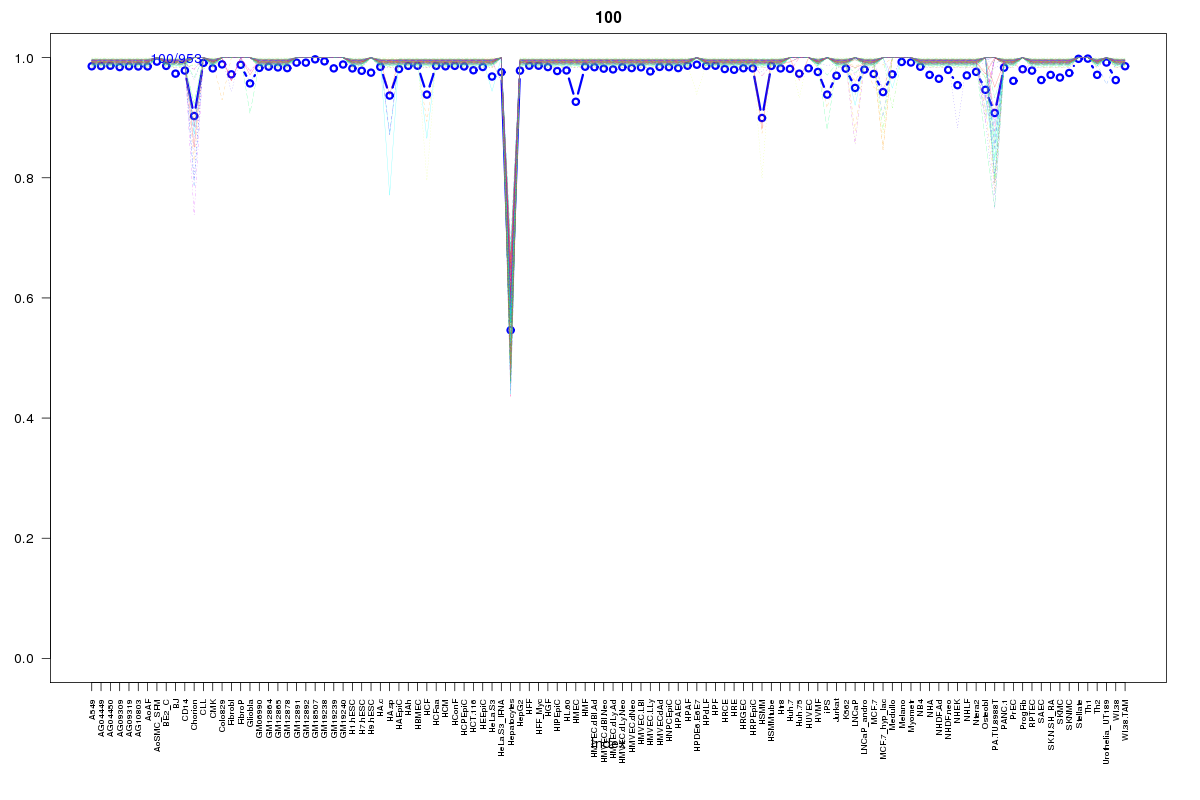 | 100 | 1 |
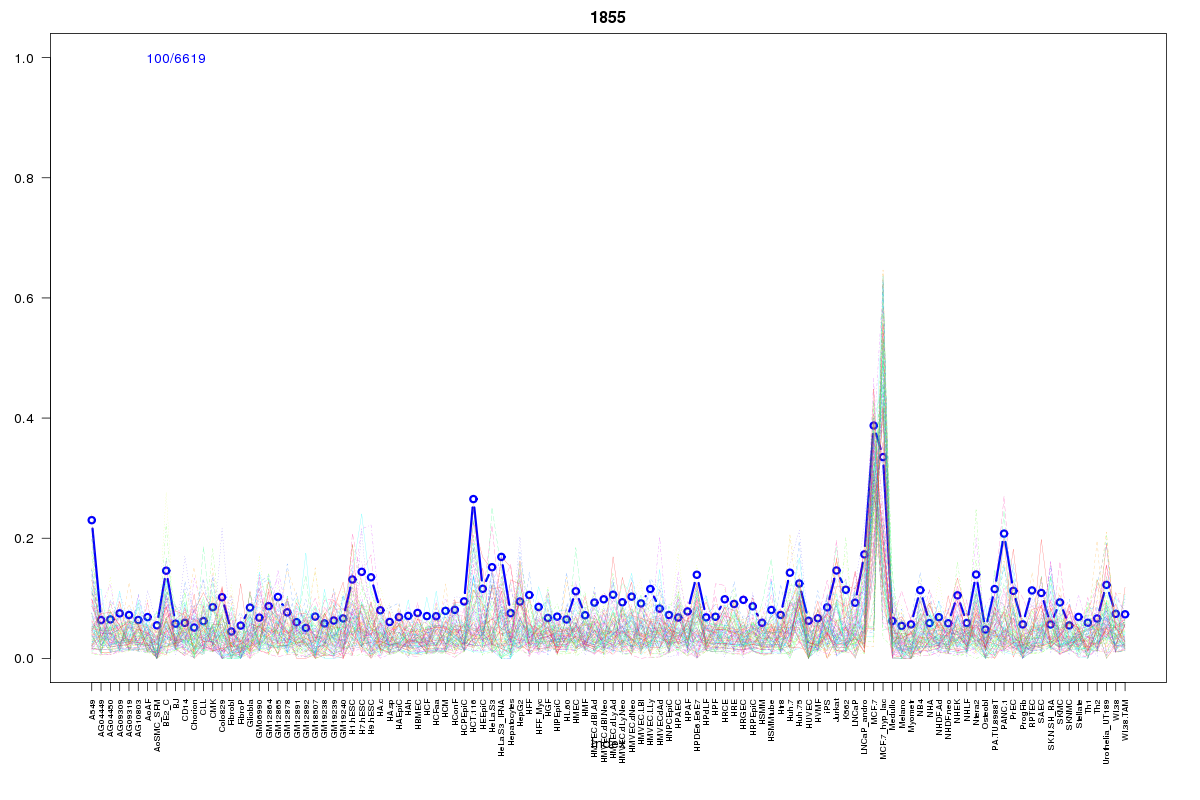 | 1855 | 1 |
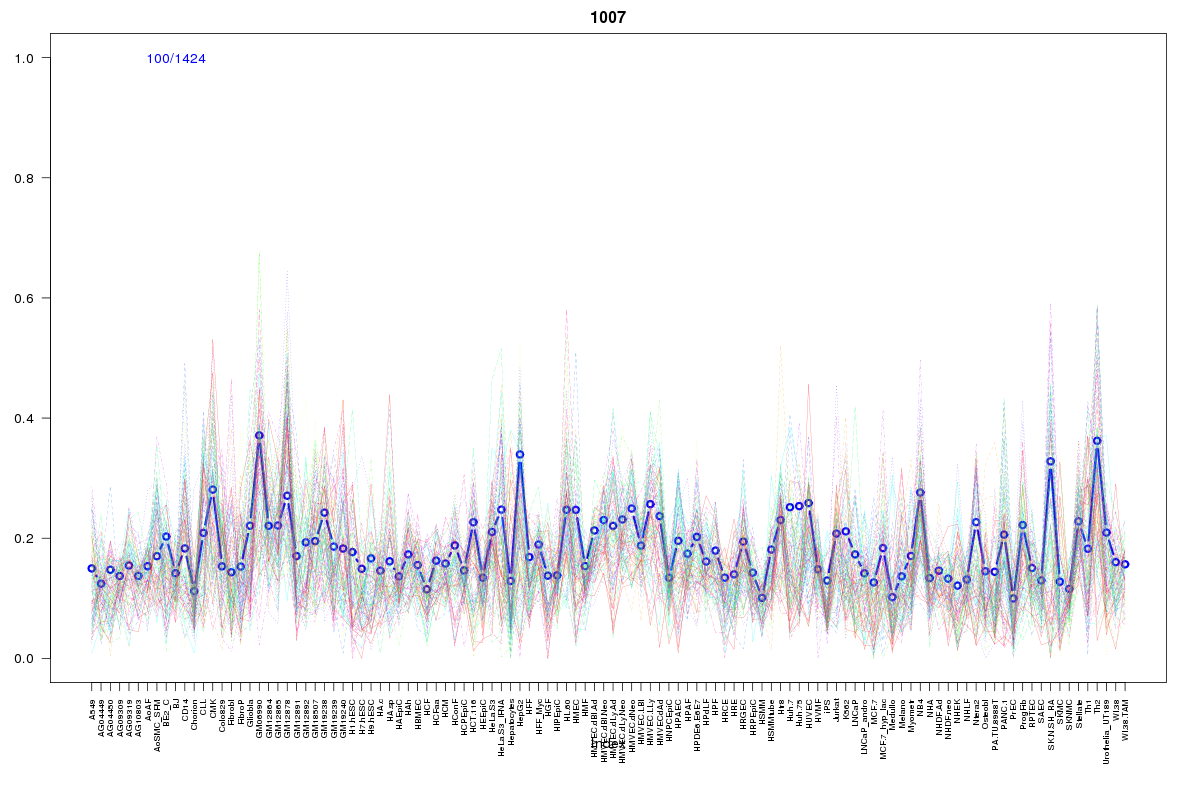 | 1007 | 1 |
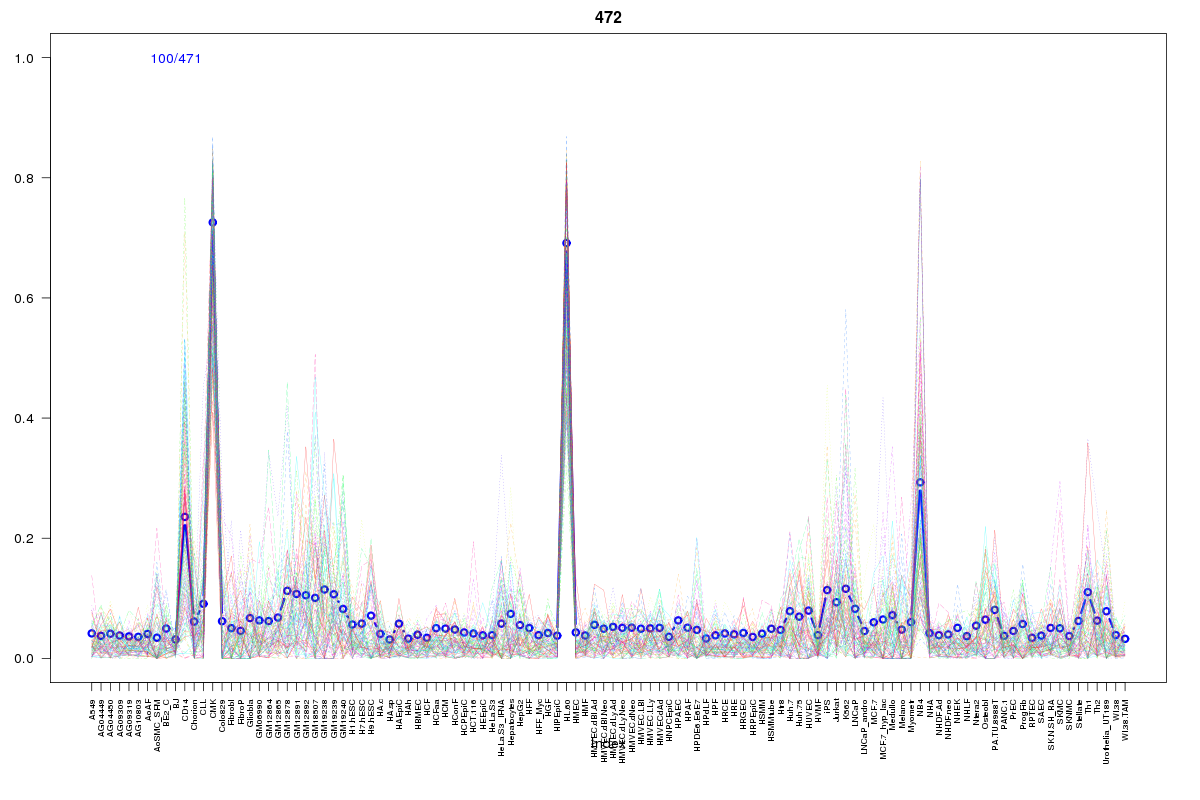 | 472 | 1 |
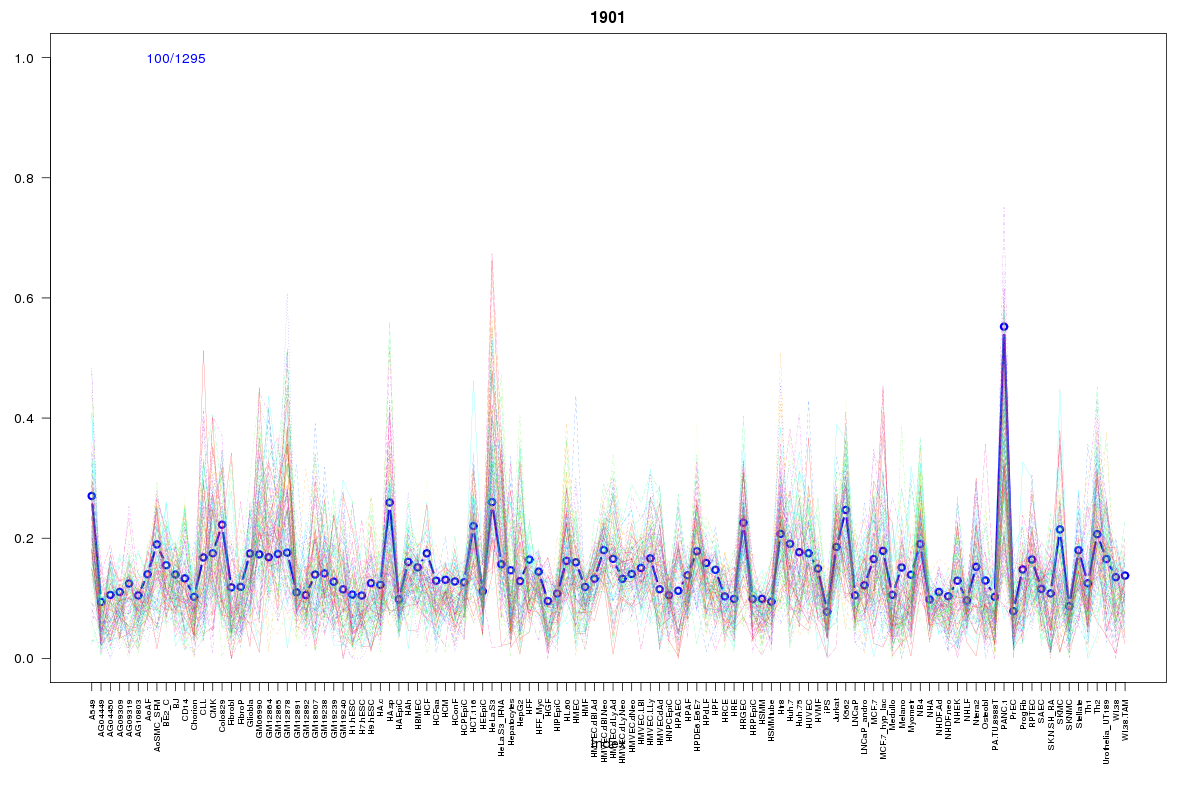 | 1901 | 1 |
 | 881 | 1 |
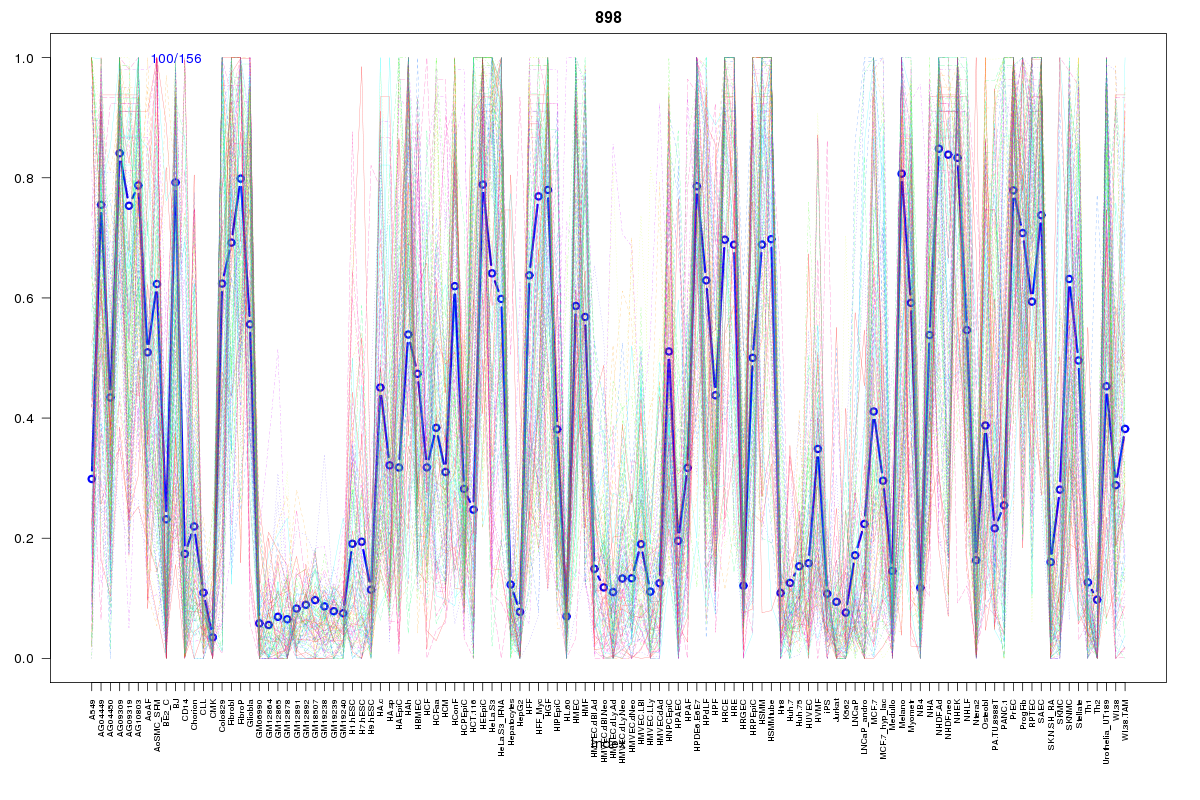 | 898 | 1 |
Resources
BED file downloads
Connects to 66 DHS sitesTop 10 Correlated DHS Sites
p-values indiciate significant higher or lower correlation| Location | Cluster | P-value |
|---|---|---|
| chr1:203085360-203085510 | 1518 | 0 |
| chr1:203061040-203061190 | 1518 | 0 |
| chr1:203141940-203142090 | 1518 | 0.001 |
| chr1:203007765-203007915 | 1472 | 0.002 |
| chr1:203068960-203069110 | 1518 | 0.002 |
| chr1:203055180-203055330 | 752 | 0.002 |
| chr1:203060025-203060175 | 1520 | 0.002 |
| chr1:203021000-203021150 | 1369 | 0.002 |
| chr1:203037060-203037210 | 1569 | 0.002 |
| chr1:203060180-203060330 | 1518 | 0.002 |
| chr1:203067680-203067830 | 1569 | 0.003 |
External Databases
UCSCEnsembl (ENSG00000122180)