SOM cluster: 1015
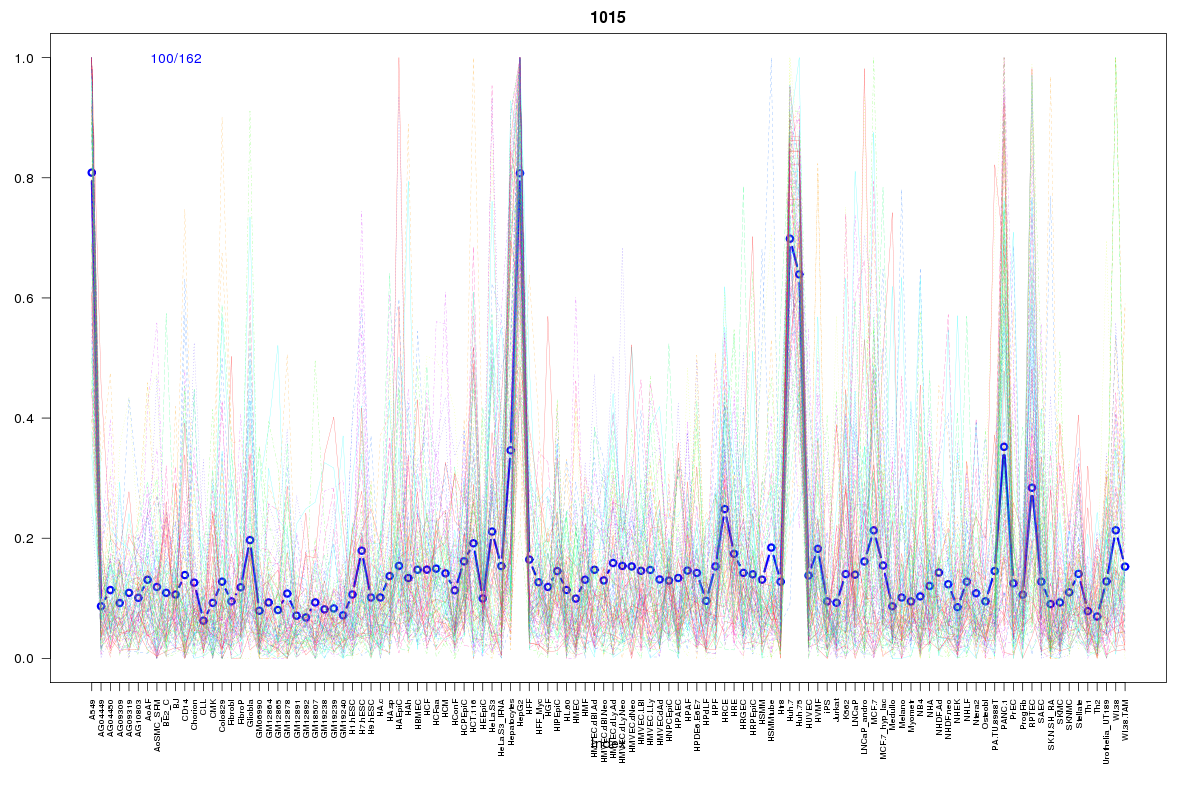
Cluster Hypersensitivity Profile

Genomic Location Trend
These plots show the distribution of the DHS sites surrounding the Transcript Start Site of the nearest gene.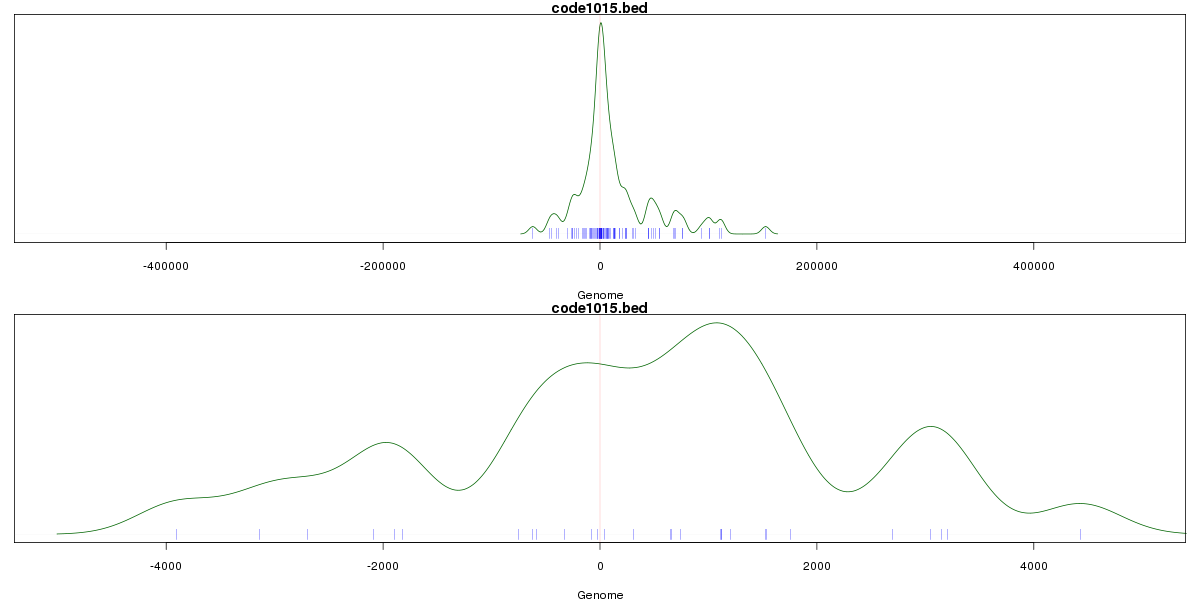
Stats
Number of sites: 162Promoter: 10%
CpG-Island: 5%
Conserved: 38%
Enriched Motifs & Matches
Match Detail: [Jaspar]
|
| ||
|---|---|---|
| Sites: 23/100 | e-val: 0.0000000007 | ||
| Factor | e-val(match) | DB |
| HNF4A | 0.0000000000035666 | JASPAR |
| NR2F1 | 0.000000000064099 | JASPAR |
| NR1H2::RXRA | 0.00000065985 | JASPAR |
| PPARG::RXRA | 0.000019139 | JASPAR |
| NFIC | 0.0015613 | JASPAR |
BED file downloads
Top 10 Example Regions
| Location | Gene Link | Dist. |
|---|---|---|
| chr9: 75473300-75473450 | ALDH1A1 | 41.93 |
| chr9: 75473300-75473450 | RP11-151D14.1 | 41.93 |
| chrX: 2845740-2845890 | GYG2 | 51.78 |
| chrX: 2845740-2845890 | ARSE | 51.78 |
| chr7: 47620060-47620210 | TNS3 | 54.67 |
| chr7: 47620060-47620210 | AC095067.1 | 54.67 |
| chr9: 78988160-78988310 | PCSK5 | 60.21 |
| chr16: 75340320-75340470 | CTRB2 | 61.05 |
| chr16: 75340320-75340470 | BCAR1 | 61.05 |
| chr20: 49016740-49016890 | RP11-290F20.1 | 62.36 |