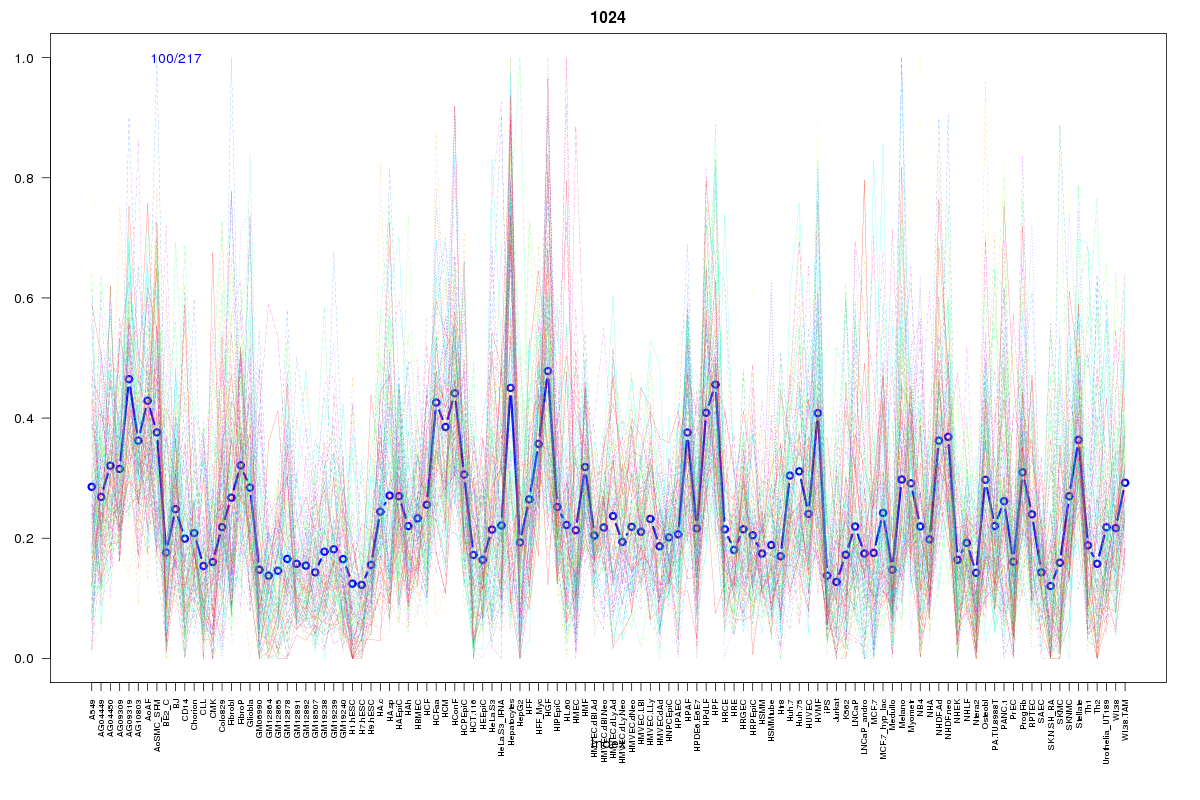
SOM cluster: 1024
Cluster Hypersensitivity Profile

Genomic Location Trend
These plots show the distribution of the DHS sites surrounding the Transcript Start Site of the nearest gene.
Stats
Number of sites: 217Promoter: 28%
CpG-Island: 11%
Conserved: 48%
Enriched Motifs & Matches
Match Detail: [Jaspar]
|
| ||
|---|---|---|
| Sites: 22/100 | e-val: 0.000029 | ||
| Factor | e-val(match) | DB |
| EWSR1-FLI1 | 0.00011996 | JASPAR |
| NFATC2 | 0.00034226 | JASPAR |
| IRF2 | 0.0013889 | JASPAR |
| FEV | 0.0019217 | JASPAR |
| IRF1 | 0.003541 | JASPAR |
BED file downloads
Top 10 Example Regions
| Location | Gene Link | Dist. |
|---|---|---|
| chr12: 93772600-93772750 | MRPL42 | 28.93 |
| chr3: 48128725-48128875 | MAP4 | 34.11 |
| chr3: 48128725-48128875 | CDC25A | 34.11 |
| chr3: 48128725-48128875 | NDUFB1P1 | 34.11 |
| chr2: 29337900-29338050 | CLIP4 | 41.73 |
| chr17: 18088840-18088990 | LLGL1 | 45.99 |
| chr17: 18088840-18088990 | TOP3A | 45.99 |
| chr6: 119671760-119671910 | MAN1A1 | 48.22 |
| chr11: 18406145-18406295 | LDHA | 49.38 |
| chr17: 73865640-73865790 | TRIM47 | 49.91 |