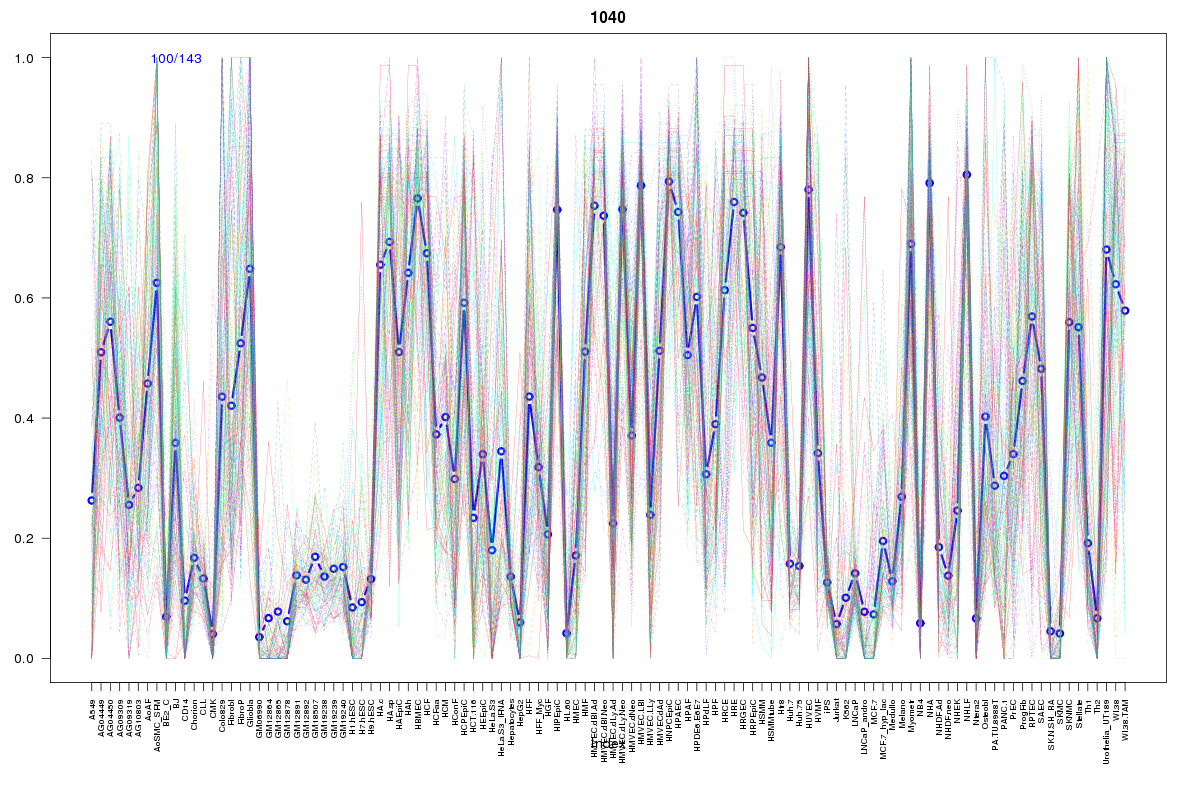
SOM cluster: 1040
Cluster Hypersensitivity Profile

Genomic Location Trend
These plots show the distribution of the DHS sites surrounding the Transcript Start Site of the nearest gene.
Stats
Number of sites: 143Promoter: 4%
CpG-Island: 0%
Conserved: 48%
Enriched Motifs & Matches
Match Detail: [Jaspar]
|
| ||
|---|---|---|
| Sites: 58/100 | e-val: 1.7e-30 | ||
| Factor | e-val(match) | DB |
| NFE2L2 | 0.00000000012795 | JASPAR |
| AP1 | 0.0000000005691 | JASPAR |
| NFE2L1::MafG | 0.00016651 | JASPAR |
| PPARG | 0.0051812 | JASPAR |
| PBX1 | 0.0067646 | JASPAR |
BED file downloads
Top 10 Example Regions
| Location | Gene Link | Dist. |
|---|---|---|
| chr1: 150971760-150971910 | MLLT11 | 13.56 |
| chrX: 9908520-9908670 | WWC3 | 46.65 |
| chrX: 9908520-9908670 | SHROOM2 | 46.65 |
| chr3: 168830060-168830210 | MECOM | 48.57 |
| chr2: 109204140-109204290 | LIMS1 | 54.11 |
| chr2: 109204140-109204290 | AC010095.5 | 54.11 |
| chr5: 109201580-109201730 | MAN2A1 | 68.33 |
| chrX: 129252500-129252650 | AIFM1 | 68.83 |
| chrX: 129252500-129252650 | RAB33A | 68.83 |
| chr5: 657840-657990 | ZDHHC11 | 68.85 |