SOM cluster: 1041
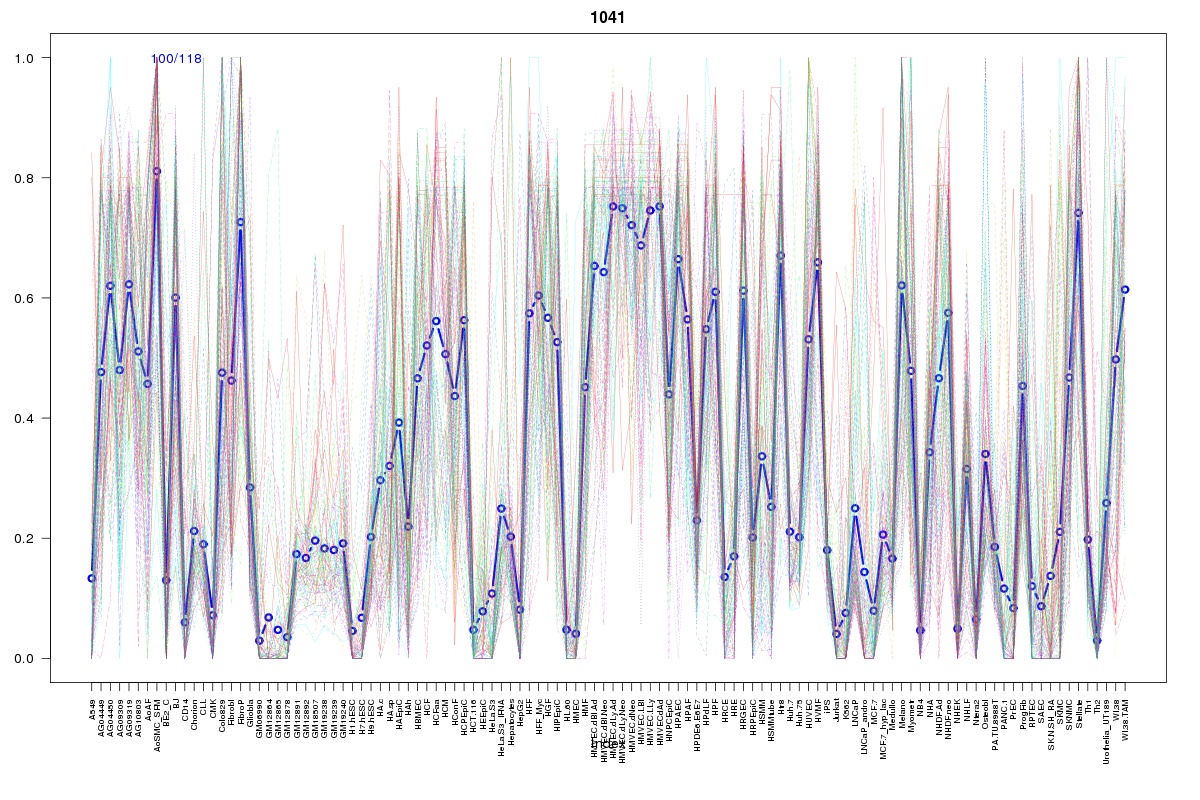
Cluster Hypersensitivity Profile

Genomic Location Trend
These plots show the distribution of the DHS sites surrounding the Transcript Start Site of the nearest gene.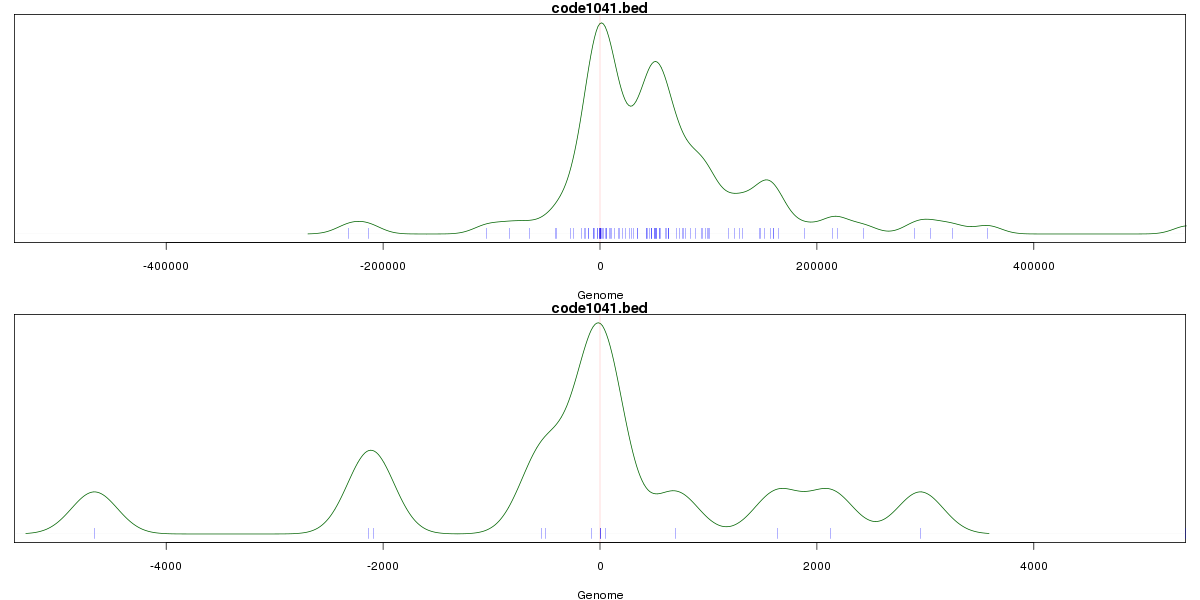
Stats
Number of sites: 118Promoter: 7%
CpG-Island: 0%
Conserved: 65%
Enriched Motifs & Matches
Match Detail: [Jaspar]
|
| ||
|---|---|---|
| Sites: 33/100 | e-val: 0.0097 | ||
| Factor | e-val(match) | DB |
| NFATC2 | 0.0000026162 | JASPAR |
| FEV | 0.0014338 | JASPAR |
| Pou5f1 | 0.0014466 | JASPAR |
| Sox2 | 0.0034251 | JASPAR |
| Foxd3 | 0.0077205 | JASPAR |
BED file downloads
Top 10 Example Regions
| Location | Gene Link | Dist. |
|---|---|---|
| chr2: 102080705-102080855 | AC092570.2 | 55.03 |
| chr2: 102080705-102080855 | CREG2 | 55.03 |
| chr19: 8499360-8499510 | PRAM1 | 59.01 |
| chr19: 8499360-8499510 | MYO1F | 59.01 |
| chr19: 8499360-8499510 | HNRNPM | 59.01 |
| chr17: 27235960-27236110 | DHRS13 | 62.27 |
| chr11: 74533320-74533470 | CHRDL2 | 62.62 |
| chr1: 236173200-236173350 | NID1 | 63.79 |
| chr1: 236173200-236173350 | RP4-580N22.2 | 63.79 |
| chr2: 46484720-46484870 | EPAS1 | 66.13 |