SOM cluster: 1059
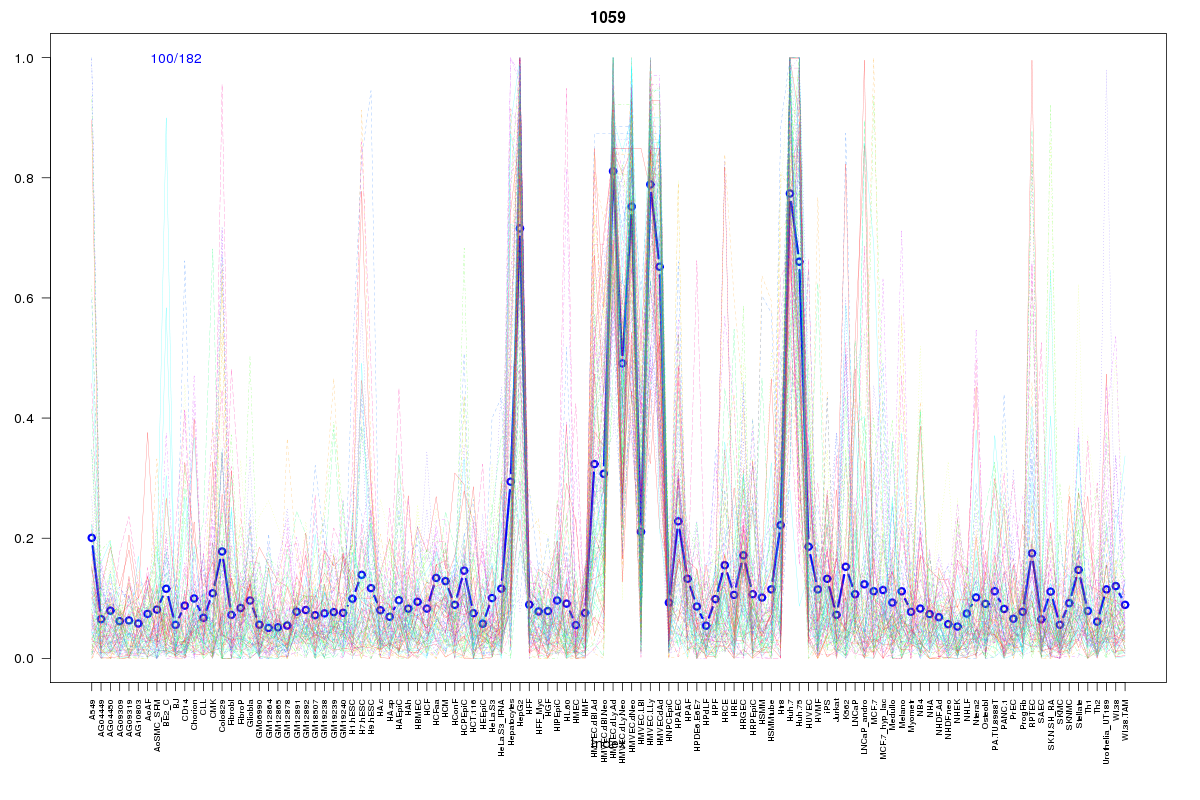
Cluster Hypersensitivity Profile

Genomic Location Trend
These plots show the distribution of the DHS sites surrounding the Transcript Start Site of the nearest gene.
Stats
Number of sites: 182Promoter: 6%
CpG-Island: 0%
Conserved: 41%
Enriched Motifs & Matches
Match Detail: [Jaspar]
|
| ||
|---|---|---|
| Sites: 19/100 | e-val: 0.79 | ||
| Factor | e-val(match) | DB |
| NR2F1 | 0 | JASPAR |
| HNF4A | 0.000000000005135 | JASPAR |
| NR1H2::RXRA | 0.000000035705 | JASPAR |
| PPARG::RXRA | 0.00000012088 | JASPAR |
| NR4A2 | 0.0000051094 | JASPAR |
BED file downloads
Top 10 Example Regions
| Location | Gene Link | Dist. |
|---|---|---|
| chr9: 139438485-139438635 | NOTCH1 | 40.98 |
| chr12: 120988020-120988170 | DYNLL1 | 53.46 |
| chr12: 120988020-120988170 | RPL29P24 | 53.46 |
| chr5: 175868140-175868290 | SIMC1 | 59.61 |
| chr5: 175868140-175868290 | KIAA1191 | 59.61 |
| chr4: 152126300-152126450 | SH3D19 | 59.95 |
| chr17: 188820-188970 | RPH3AL | 65.77 |
| chr17: 188820-188970 | C17orf97 | 65.77 |
| chr1: 214217980-214218130 | PROX1 | 68.35 |
| chr1: 214217980-214218130 | PROX1-AS1 | 68.35 |