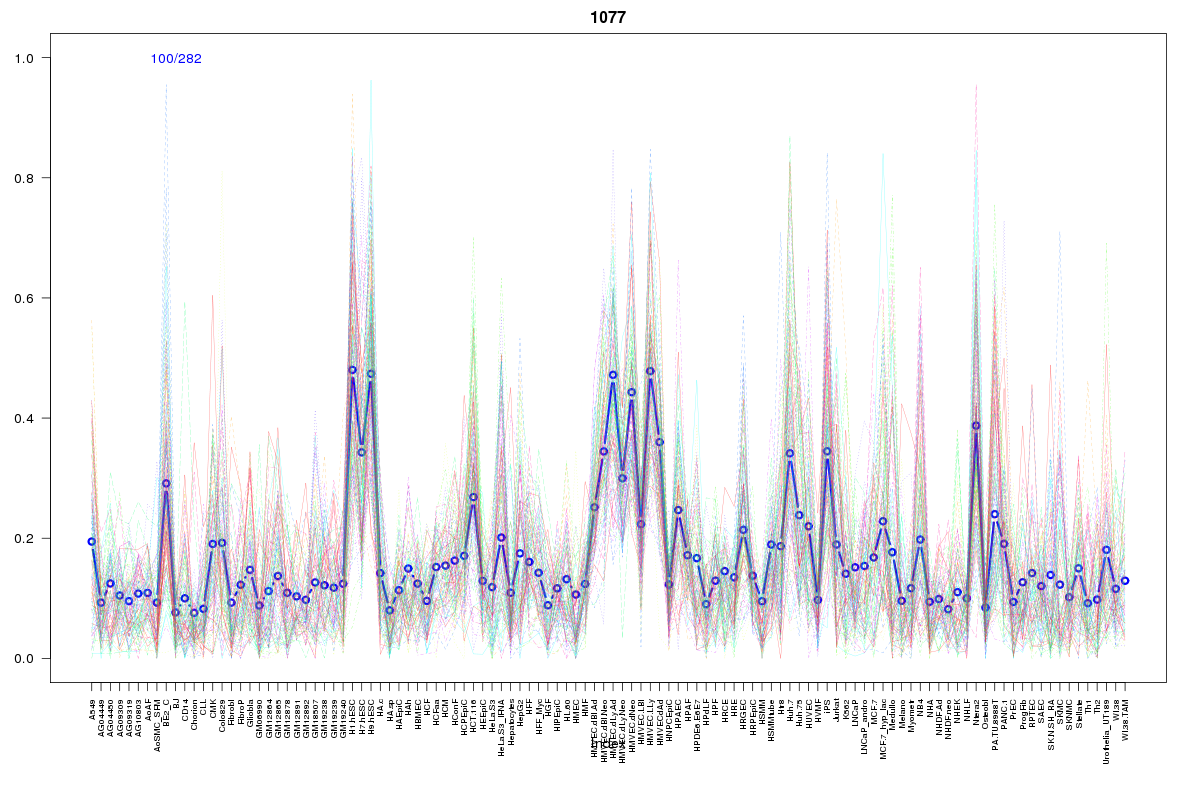
SOM cluster: 1077
Cluster Hypersensitivity Profile

Genomic Location Trend
These plots show the distribution of the DHS sites surrounding the Transcript Start Site of the nearest gene.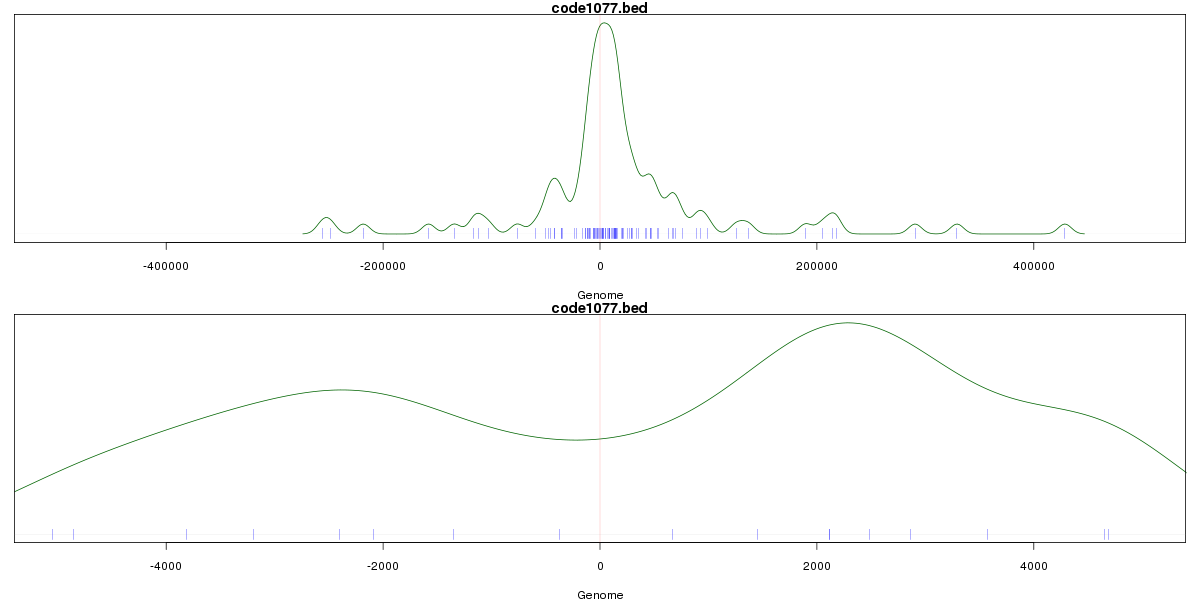
Stats
Number of sites: 282Promoter: 2%
CpG-Island: 2%
Conserved: 32%
Enriched Motifs & Matches
Match Detail: [Jaspar]
|
| ||
|---|---|---|
| Sites: 57/100 | e-val: 1.26117e-44 | ||
| Factor | e-val(match) | DB |
| CTCF | 0 | JASPAR |
| INSM1 | 0.0000029207 | JASPAR |
| PLAG1 | 0.0005823 | JASPAR |
| Zfp423 | 0.00075925 | JASPAR |
| SP1 | 0.00082074 | JASPAR |
BED file downloads
Top 10 Example Regions
| Location | Gene Link | Dist. |
|---|---|---|
| chr17: 18095365-18095515 | snoU13 | 28.9 |
| chr8: 6643125-6643275 | AGPAT5 | 37.72 |
| chr10: 82271265-82271415 | TSPAN14 | 43.76 |
| chr10: 82271265-82271415 | FAM213A | 43.76 |
| chr6: 118151080-118151230 | SLC35F1 | 49.95 |
| chr9: 34256260-34256410 | UBAP1 | 58.11 |
| chr2: 128622585-128622735 | POLR2D | 59.37 |
| chr17: 58239040-58239190 | CA4 | 60.46 |
| chrX: 99986505-99986655 | SYTL4 | 62.04 |
| chr3: 126195525-126195675 | ZXDC | 62.27 |