SOM cluster: 1082
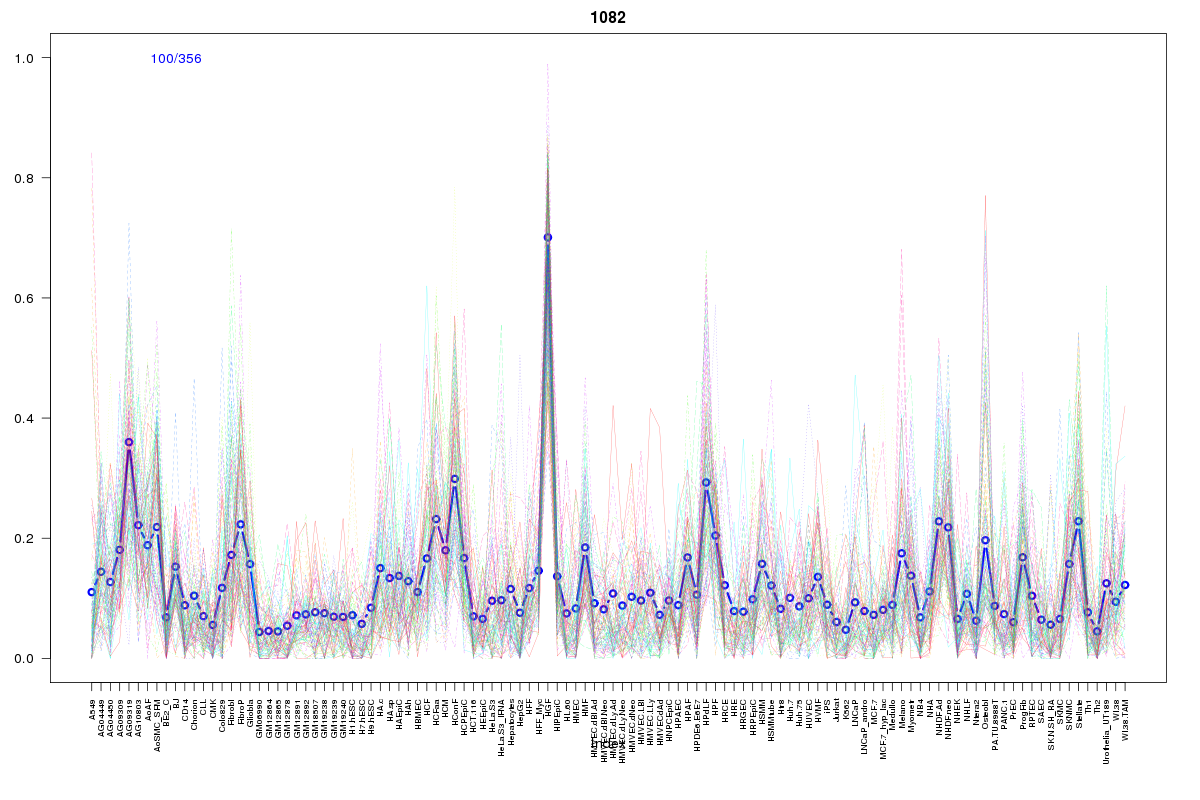
Cluster Hypersensitivity Profile

Genomic Location Trend
These plots show the distribution of the DHS sites surrounding the Transcript Start Site of the nearest gene.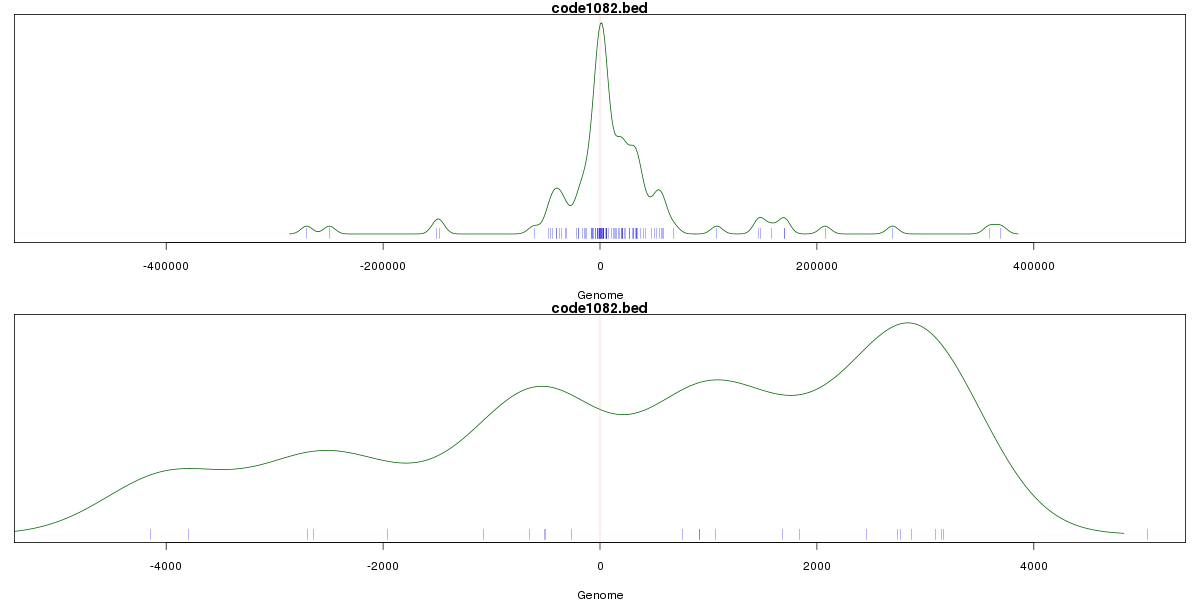
Stats
Number of sites: 356Promoter: 6%
CpG-Island: 1%
Conserved: 36%
Enriched Motifs & Matches
Match Detail: [Jaspar]
|
| ||
|---|---|---|
| Sites: 14/100 | e-val: 0.011 | ||
| Factor | e-val(match) | DB |
| Pax4 | 0.001165 | JASPAR |
| NFATC2 | 0.0015016 | JASPAR |
| HNF1B | 0.0022519 | JASPAR |
| NR2F1 | 0.0024366 | JASPAR |
| Foxd3 | 0.011414 | JASPAR |
BED file downloads
Top 10 Example Regions
| Location | Gene Link | Dist. |
|---|---|---|
| chr5: 65215765-65215915 | ERBB2IP | 45.59 |
| chr11: 65216760-65216910 | NEAT1 | 48.16 |
| chr2: 228582985-228583135 | SLC19A3 | 50.52 |
| chr2: 228582985-228583135 | AC064853.3 | 50.52 |
| chr3: 133266325-133266475 | TOPBP1 | 50.6 |
| chr3: 133266325-133266475 | BFSP2 | 50.6 |
| chr9: 133670445-133670595 | ABL1 | 51.47 |
| chr2: 152194440-152194590 | TNFAIP6 | 51.83 |
| chr2: 152194440-152194590 | RN7SL124P | 51.83 |
| chr1: 145093560-145093710 | PDE4DIP | 53.41 |