SOM cluster: 1089
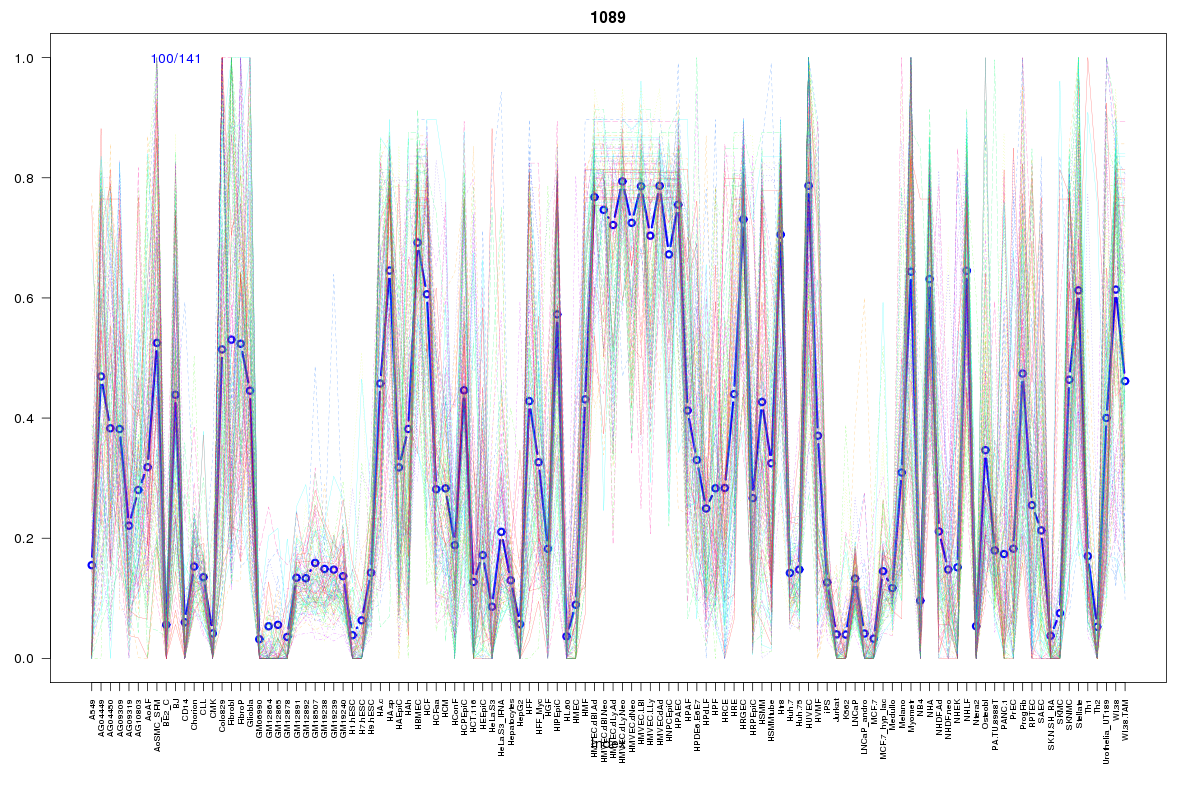
Cluster Hypersensitivity Profile

Genomic Location Trend
These plots show the distribution of the DHS sites surrounding the Transcript Start Site of the nearest gene.
Stats
Number of sites: 141Promoter: 1%
CpG-Island: 0%
Conserved: 57%
Enriched Motifs & Matches
Match Detail: [Jaspar]
|
| ||
|---|---|---|
| Sites: 58/100 | e-val: 4.6e-28 | ||
| Factor | e-val(match) | DB |
| NFE2L2 | 0.00000000013625 | JASPAR |
| AP1 | 0.00000000014015 | JASPAR |
| NFE2L1::MafG | 0.000045732 | JASPAR |
| PBX1 | 0.0038536 | JASPAR |
| Pax2 | 0.0085888 | JASPAR |
|
| ||
| Sites: 47/100 | e-val: 0.00000057 | ||
| Factor | e-val(match) | DB |
| FEV | 0.000000000022294 | JASPAR |
| ELF5 | 0.0000040128 | JASPAR |
| ELK4 | 0.0000042549 | JASPAR |
| SPI1 | 0.000006396 | JASPAR |
| SPIB | 0.000011198 | JASPAR |
BED file downloads
Top 10 Example Regions
| Location | Gene Link | Dist. |
|---|---|---|
| chr5: 66335220-66335370 | MAST4 | 45.94 |
| chr5: 66335220-66335370 | MAST4-AS1 | 45.94 |
| chr8: 38648600-38648750 | TACC1 | 46.11 |
| chr8: 6405380-6405530 | ANGPT2 | 48.52 |
| chr3: 124526920-124527070 | ENO1P3 | 50.1 |
| chr3: 124526920-124527070 | ITGB5-AS1 | 50.1 |
| chr3: 124526920-124527070 | ITGB5 | 50.1 |
| chr3: 124526920-124527070 | UMPS | 50.1 |
| chr1: 66971920-66972070 | SGIP1 | 60.59 |
| chr1: 94607800-94607950 | ARHGAP29 | 65.19 |