SOM cluster: 110
Cluster Hypersensitivity Profile

Genomic Location Trend
These plots show the distribution of the DHS sites surrounding the Transcript Start Site of the nearest gene.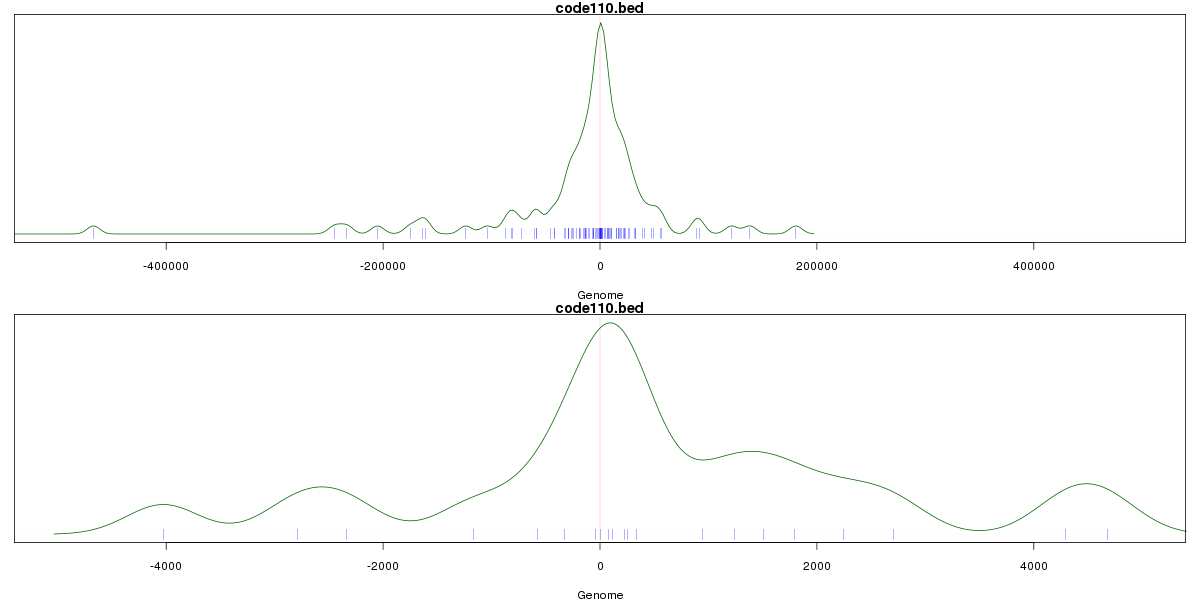
Stats
Number of sites: 2519Promoter: 4%
CpG-Island: 42%
Conserved: 40%
Enriched Motifs & Matches
Match Detail: [Jaspar]
|
| ||
|---|---|---|
| Sites: 81/100 | e-val: 6.3e-27 | ||
| Factor | e-val(match) | DB |
| SP1 | 0.0000000090733 | JASPAR |
| Klf4 | 0.00048464 | JASPAR |
| Pax4 | 0.00067791 | JASPAR |
| INSM1 | 0.00091073 | JASPAR |
| TFAP2A | 0.0022869 | JASPAR |
|
| ||
| Sites: 47/100 | e-val: 0.00000066 | ||
| Factor | e-val(match) | DB |
| CTCF | 0.000000011244 | JASPAR |
| PLAG1 | 0.0038224 | JASPAR |
| INSM1 | 0.0040553 | JASPAR |
| TFAP2A | 0.019984 | JASPAR |
| Zfp423 | 0.021258 | JASPAR |
BED file downloads
Top 10 Example Regions
| Location | Gene Link | Dist. |
|---|---|---|
| chr1: 151105905-151106055 | GABPB2 | 13.02 |
| chr17: 38502585-38502735 | WIPF2 | 23.47 |
| chr17: 38502585-38502735 | RARA | 23.47 |
| chr1: 149719385-149719535 | RP11-196G18.3 | 27.09 |
| chr10: 17269160-17269310 | TRDMT1 | 32.98 |
| chr1: 145533505-145533655 | POLR3GL | 39.45 |
| chr1: 145533505-145533655 | LIX1L | 39.45 |
| chr1: 145533505-145533655 | ANKRD34A | 39.45 |
| chr1: 151458265-151458415 | CGN | 41.85 |
| chr4: 189702900-189703050 | RP11-756P10.5 | 44.67 |