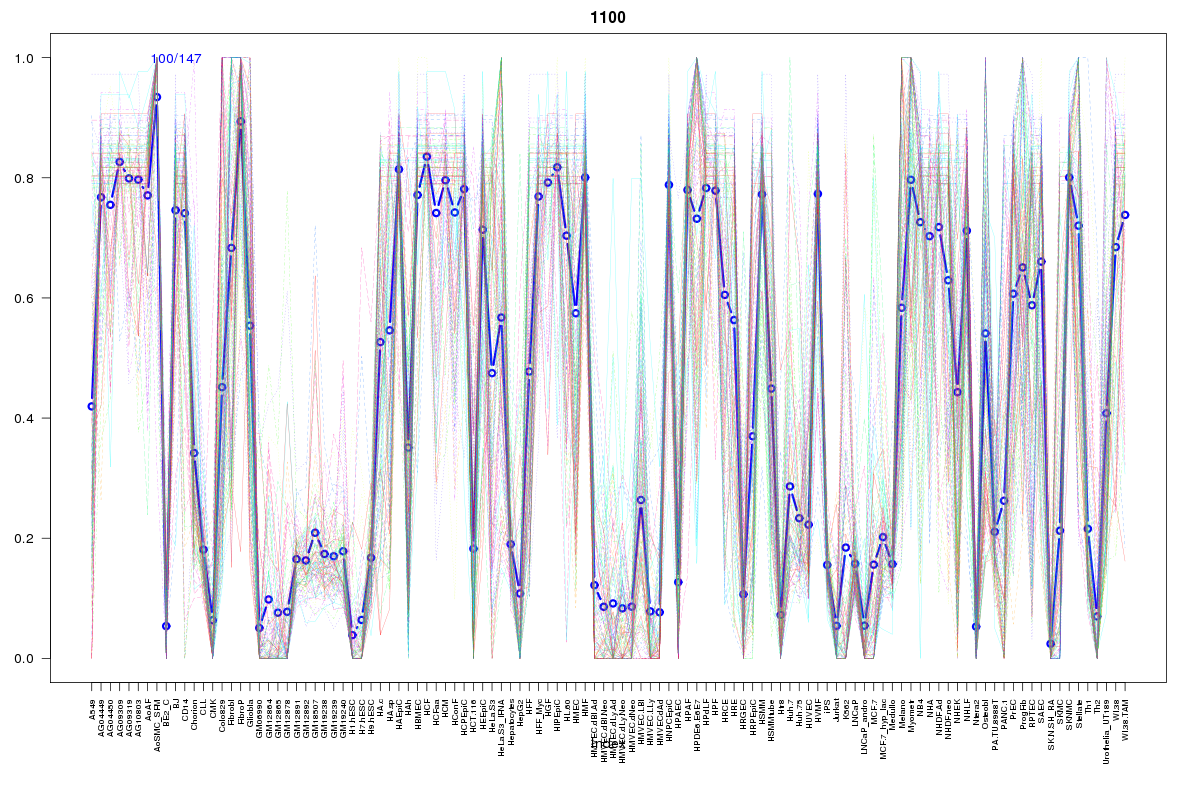
SOM cluster: 1100
Cluster Hypersensitivity Profile

Genomic Location Trend
These plots show the distribution of the DHS sites surrounding the Transcript Start Site of the nearest gene.
Stats
Number of sites: 147Promoter: 1%
CpG-Island: 0%
Conserved: 43%
Enriched Motifs & Matches
Match Detail: [Jaspar]
|
| ||
|---|---|---|
| Sites: 47/100 | e-val: 0.0000000000000025 | ||
| Factor | e-val(match) | DB |
| AP1 | 0.000000018456 | JASPAR |
| NFE2L2 | 0.000000024806 | JASPAR |
| NFE2L1::MafG | 0.0042933 | JASPAR |
| Pax2 | 0.037899 | JASPAR |
| GATA2 | 0.067526 | JASPAR |
|
| ||
| Sites: 35/100 | e-val: 0.0000009 | ||
| Factor | e-val(match) | DB |
| CEBPA | 0.0000000036057 | JASPAR |
| HLF | 0.00003731 | JASPAR |
| Pou5f1 | 0.00044825 | JASPAR |
| Sox2 | 0.00072302 | JASPAR |
| Ddit3::Cebpa | 0.0011168 | JASPAR |