SOM cluster: 1106
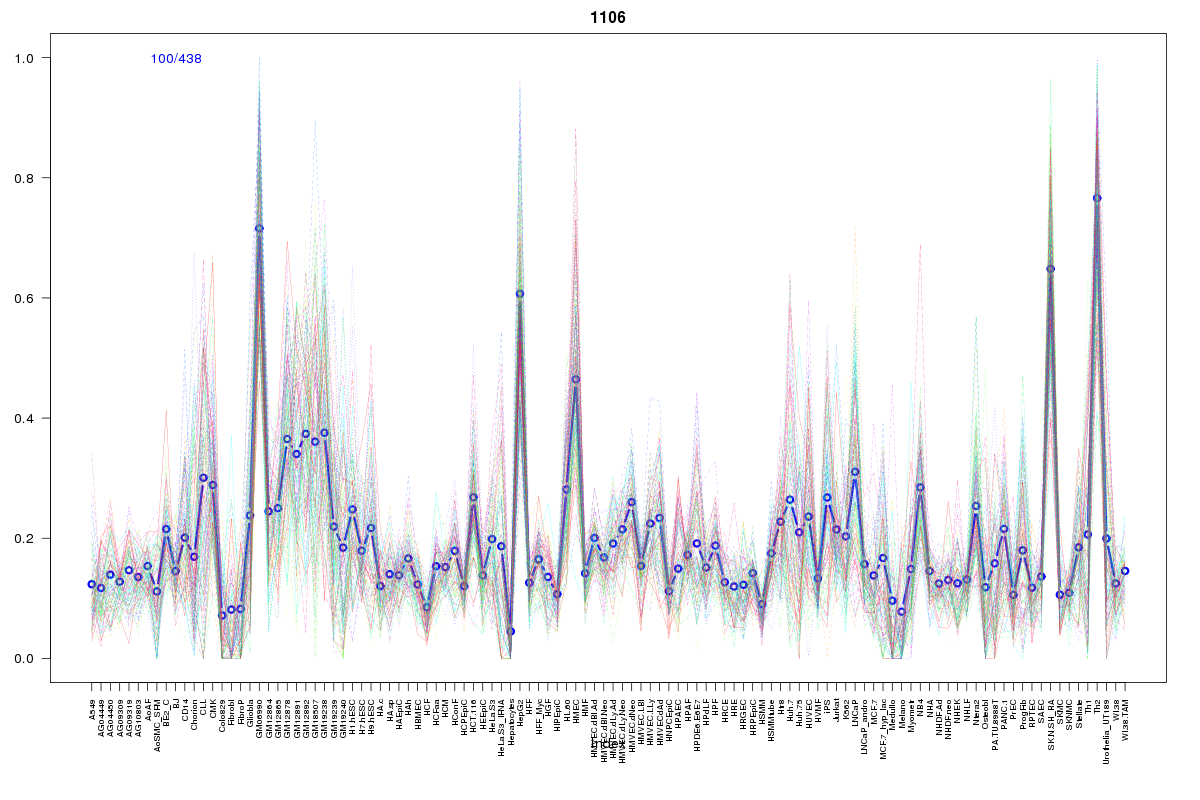
Cluster Hypersensitivity Profile

Genomic Location Trend
These plots show the distribution of the DHS sites surrounding the Transcript Start Site of the nearest gene.
Stats
Number of sites: 438Promoter: 20%
CpG-Island: 99%
Conserved: 72%
Enriched Motifs & Matches
Match Detail: [Jaspar]
|
| ||
|---|---|---|
| Sites: 92/100 | e-val: 0 | ||
| Factor | e-val(match) | DB |
| SP1 | 0.00000039771 | JASPAR |
| TFAP2A | 0.0011382 | JASPAR |
| Egr1 | 0.010414 | JASPAR |
| Klf4 | 0.011872 | JASPAR |
| Zfx | 0.02175 | JASPAR |
|
| ||
| Sites: 95/100 | e-val: 1.8e-36 | ||
| Factor | e-val(match) | DB |
| SP1 | 0.00000075988 | JASPAR |
| PLAG1 | 0.000017796 | JASPAR |
| TFAP2A | 0.000048107 | JASPAR |
| Klf4 | 0.00094035 | JASPAR |
| RREB1 | 0.0087549 | JASPAR |
|
| ||
| Sites: 73/100 | e-val: 0.00000000000049 | ||
| Factor | e-val(match) | DB |
| SP1 | 0.00000014361 | JASPAR |
| EWSR1-FLI1 | 0.00011509 | JASPAR |
| PLAG1 | 0.00023567 | JASPAR |
| Egr1 | 0.0022531 | JASPAR |
| INSM1 | 0.040672 | JASPAR |
BED file downloads
Top 10 Example Regions
| Location | Gene Link | Dist. |
|---|---|---|
| chr12: 27933605-27933755 | PPFIBP1 | 32.74 |
| chr12: 27933605-27933755 | REP15 | 32.74 |
| chr12: 27933605-27933755 | Y_RNA | 32.74 |
| chr12: 27933605-27933755 | MRPS35 | 32.74 |
| chr12: 76953120-76953270 | RP11-613M5.1 | 32.79 |
| chr5: 114961440-114961590 | AC010226.4 | 35.87 |
| chr16: 88636925-88637075 | ZC3H18 | 43.18 |
| chr16: 88636925-88637075 | MVD | 43.18 |
| chr1: 202318040-202318190 | UBE2T | 43.69 |
| chr1: 53018465-53018615 | ZCCHC11 | 44.6 |