SOM cluster: 111
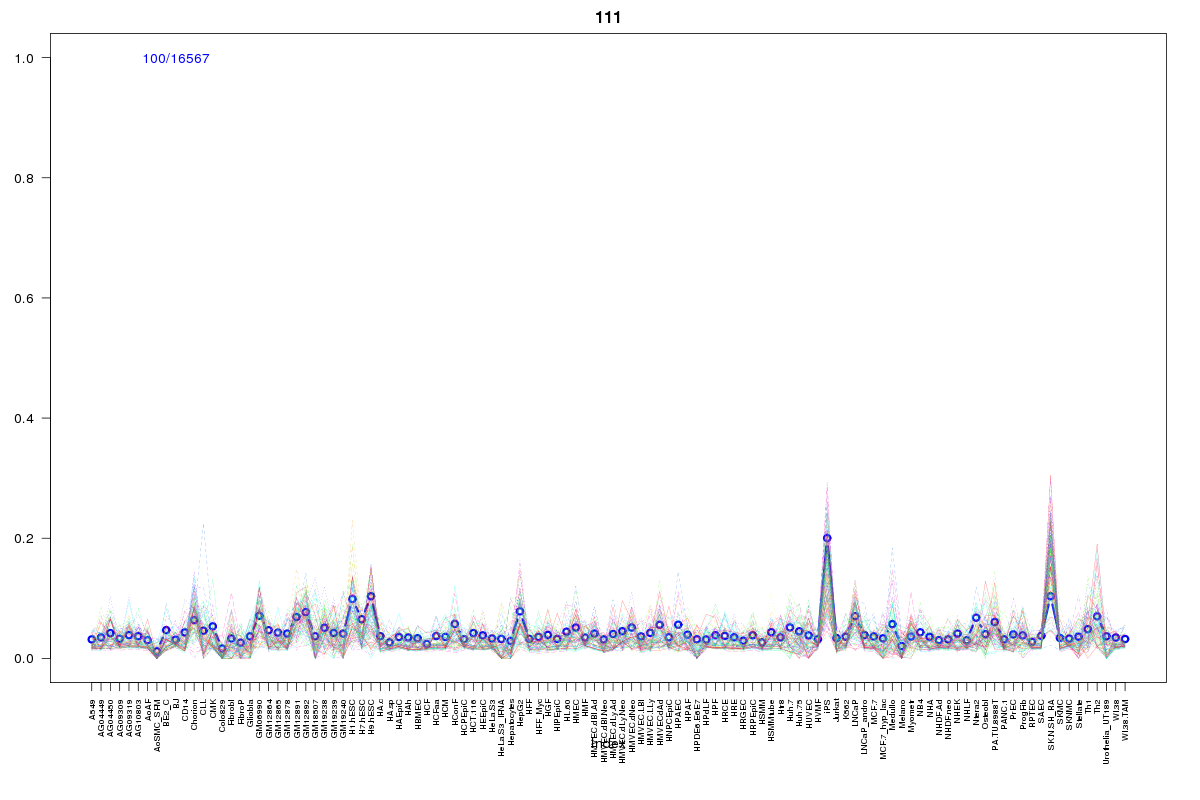
Cluster Hypersensitivity Profile

Genomic Location Trend
These plots show the distribution of the DHS sites surrounding the Transcript Start Site of the nearest gene.
Stats
Number of sites: 16567Promoter: 2%
CpG-Island: 37%
Conserved: 38%
Enriched Motifs & Matches
Match Detail: [Jaspar]
|
| ||
|---|---|---|
| Sites: 94/100 | e-val: 0 | ||
| Factor | e-val(match) | DB |
| TFAP2A | 0.000256 | JASPAR |
| SP1 | 0.00042673 | JASPAR |
| PLAG1 | 0.01417 | JASPAR |
| Klf4 | 0.018111 | JASPAR |
| Egr1 | 0.028388 | JASPAR |
|
| ||
| Sites: 89/100 | e-val: 7.4e-29 | ||
| Factor | e-val(match) | DB |
| SP1 | 0.000000054333 | JASPAR |
| PLAG1 | 0.000089954 | JASPAR |
| RREB1 | 0.0012659 | JASPAR |
| TFAP2A | 0.0020442 | JASPAR |
| Pax4 | 0.0037276 | JASPAR |
|
| ||
| Sites: 26/100 | e-val: 0.16 | ||
| Factor | e-val(match) | DB |
| TFAP2A | 0.00069167 | JASPAR |
| Zfx | 0.0013712 | JASPAR |
| PLAG1 | 0.0014129 | JASPAR |
| SP1 | 0.0014275 | JASPAR |
| TP53 | 0.0072221 | JASPAR |
BED file downloads
Top 10 Example Regions
| Location | Gene Link | Dist. |
|---|---|---|
| chr5: 3607160-3607310 | IRX1 | 25.51 |
| chr8: 20093545-20093695 | SLC18A1 | 26.31 |
| chr3: 128221665-128221815 | GATA2 | 31.95 |
| chr3: 128221665-128221815 | RP11-475N22.4 | 31.95 |
| chr1: 177150345-177150495 | BRINP2 | 32.24 |
| chr1: 177150345-177150495 | ASTN1 | 32.24 |
| chr8: 6481765-6481915 | CTD-2541M15.1 | 33.86 |
| chr8: 101521320-101521470 | GAPDHP62 | 36.71 |
| chr10: 3106065-3106215 | PITRM1 | 39.3 |
| chr6: 10391605-10391755 | RP1-290I10.3 | 41.77 |