SOM cluster: 1153
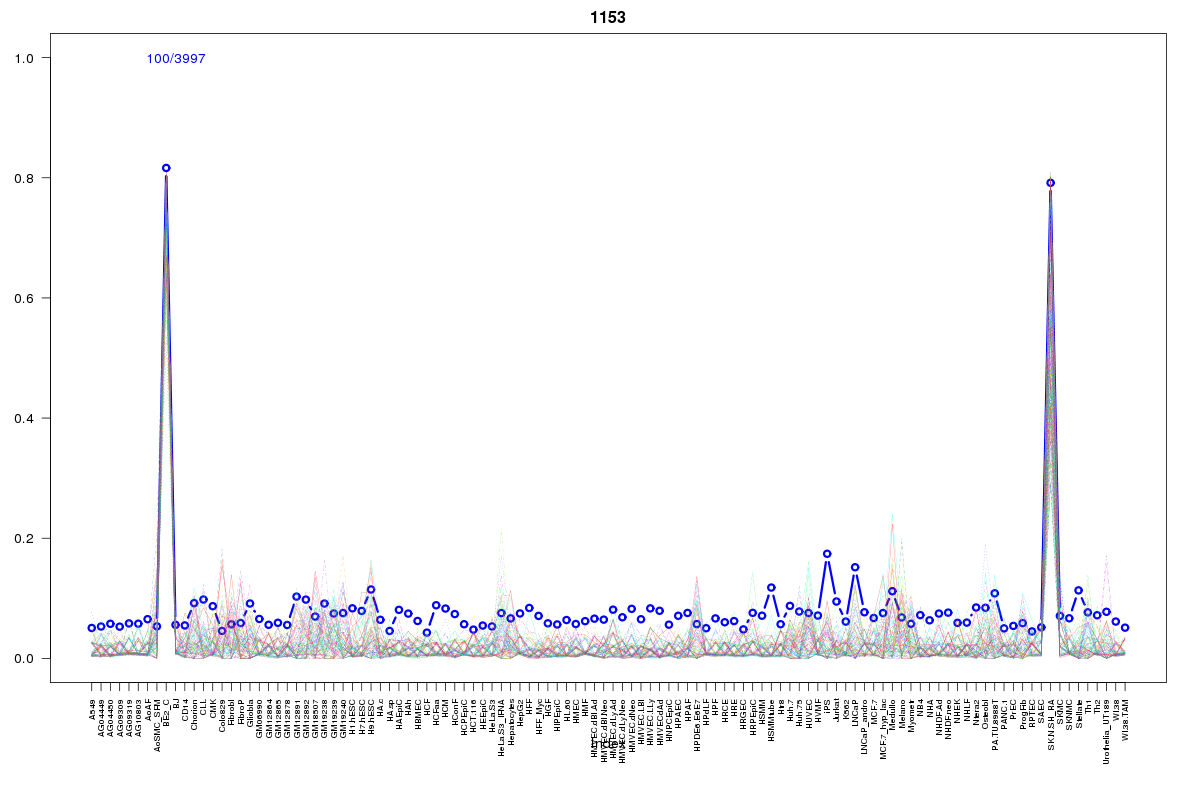
Cluster Hypersensitivity Profile

Genomic Location Trend
These plots show the distribution of the DHS sites surrounding the Transcript Start Site of the nearest gene.
Stats
Number of sites: 3997Promoter: 0%
CpG-Island: 0%
Conserved: 52%
Enriched Motifs & Matches
Match Detail: [Jaspar]
|
| ||
|---|---|---|
| Sites: 56/100 | e-val: 1.6e-30 | ||
| Factor | e-val(match) | DB |
| Lhx3 | 0.000001278 | JASPAR |
| Prrx2 | 0.000084784 | JASPAR |
| MEF2A | 0.00021712 | JASPAR |
| HNF1A | 0.00028613 | JASPAR |
| ARID3A | 0.00045307 | JASPAR |
BED file downloads
Top 10 Example Regions
| Location | Gene Link | Dist. |
|---|---|---|
| chr8: 105334020-105334170 | RIMS2 | 27.48 |
| chr13: 102848040-102848190 | FGF14-IT1 | 34.33 |
| chr12: 113248140-113248290 | RPH3A | 35.15 |
| chr8: 79341840-79341990 | RP11-594N15.2 | 35.43 |
| chr3: 38624680-38624830 | DDTP1 | 38.6 |
| chr1: 50569480-50569630 | ELAVL4 | 39.62 |
| chr1: 204553480-204553630 | MDM4 | 39.64 |
| chr1: 204553480-204553630 | RP11-23I7.1 | 39.64 |
| chr5: 66385040-66385190 | MAST4-AS1 | 40.88 |
| chr4: 95793180-95793330 | BMPR1B | 42.37 |