SOM cluster: 1173
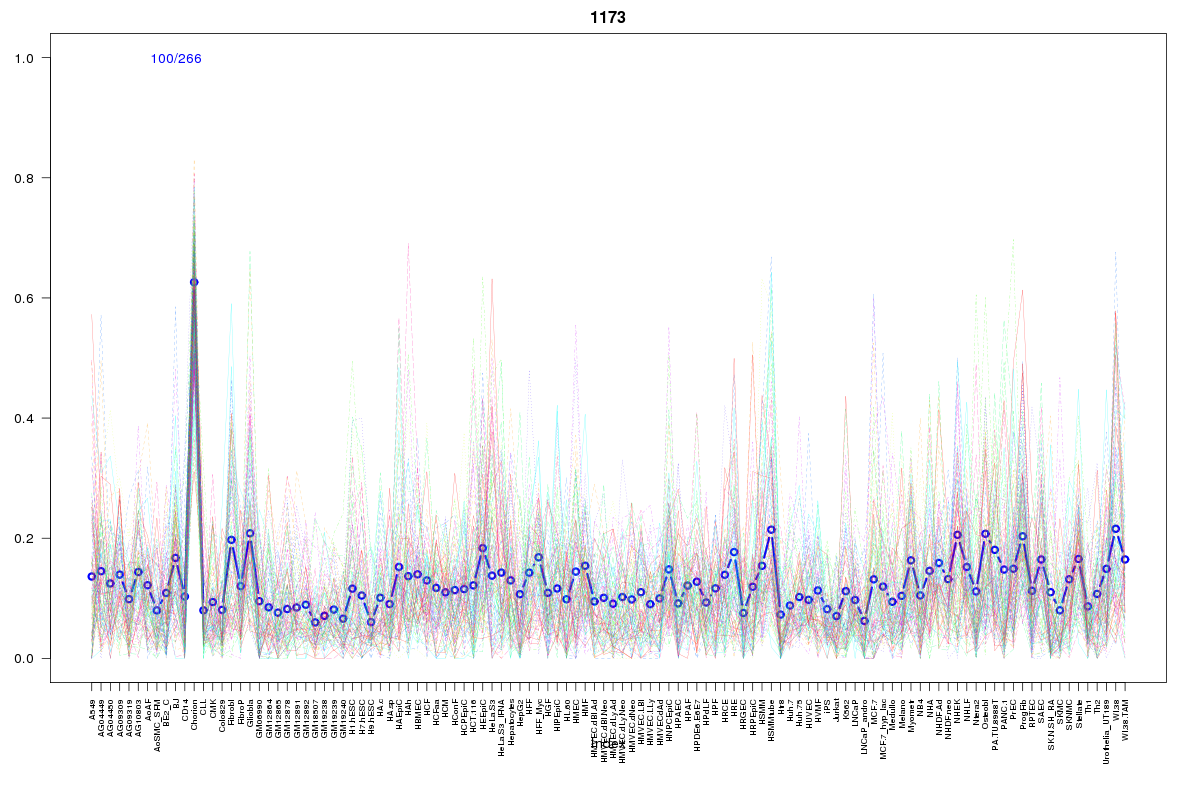
Cluster Hypersensitivity Profile

Genomic Location Trend
These plots show the distribution of the DHS sites surrounding the Transcript Start Site of the nearest gene.
Stats
Number of sites: 266Promoter: 12%
CpG-Island: 7%
Conserved: 31%
Enriched Motifs & Matches
Match Detail: [Jaspar]
|
| ||
|---|---|---|
| Sites: 15/100 | e-val: 0.66 | ||
| Factor | e-val(match) | DB |
| SPI1 | 0.0024597 | JASPAR |
| SP1 | 0.0031163 | JASPAR |
| NFATC2 | 0.01094 | JASPAR |
| Stat3 | 0.012506 | JASPAR |
| RUNX1 | 0.018841 | JASPAR |
BED file downloads
Top 10 Example Regions
| Location | Gene Link | Dist. |
|---|---|---|
| chr1: 150523160-150523310 | ADAMTSL4 | 27.33 |
| chr1: 150523160-150523310 | AL356356.1 | 27.33 |
| chr1: 150523160-150523310 | RP11-54A4.2 | 27.33 |
| chr19: 35586920-35587070 | FXYD3 | 44.73 |
| chr1: 113392825-113392975 | RP3-522D1.1 | 55.24 |
| chr16: 89335425-89335575 | ZNF778 | 58.9 |
| chr3: 42725785-42725935 | HHATL | 59.95 |
| chr3: 42725785-42725935 | KLHL40 | 59.95 |
| chr3: 42725785-42725935 | CCDC13 | 59.95 |
| chr1: 13911140-13911290 | PDPN | 61.69 |