SOM cluster: 1180
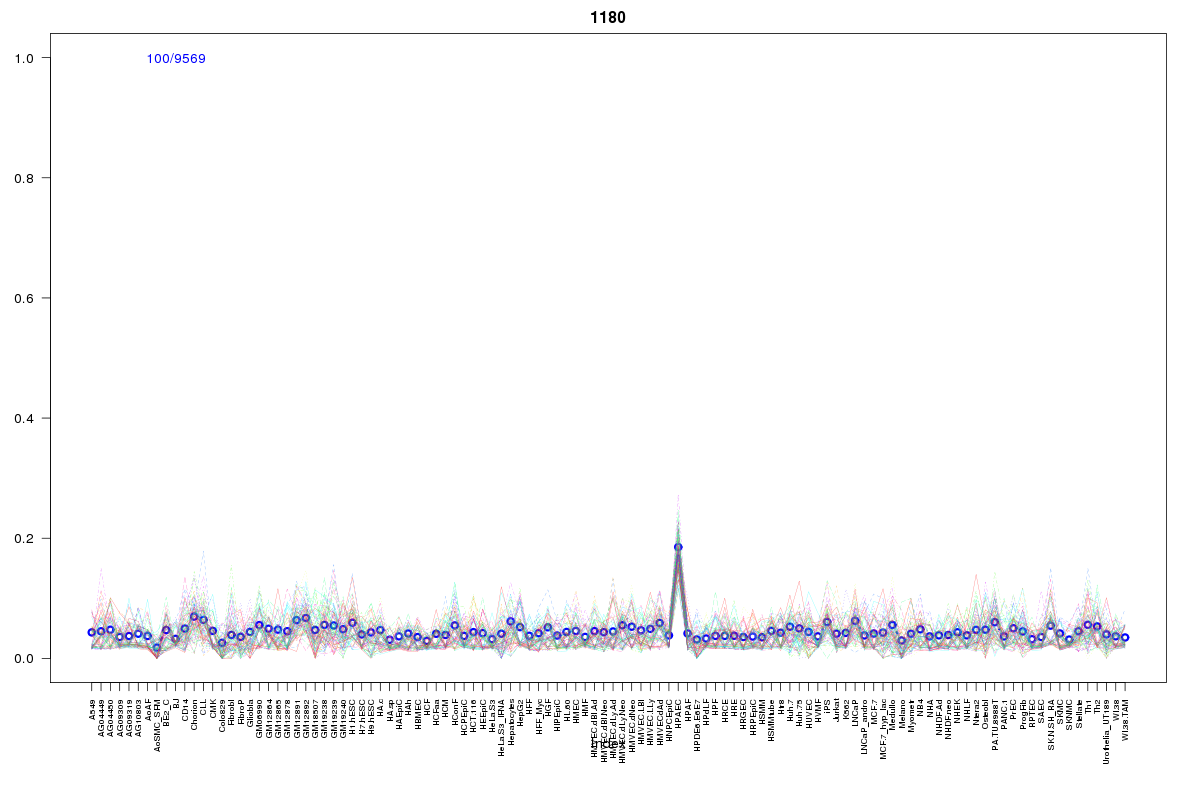
Cluster Hypersensitivity Profile

Genomic Location Trend
These plots show the distribution of the DHS sites surrounding the Transcript Start Site of the nearest gene.
Stats
Number of sites: 9569Promoter: 2%
CpG-Island: 1%
Conserved: 18%
Enriched Motifs & Matches
Match Detail: [Jaspar]
|
| ||
|---|---|---|
| Sites: 56/100 | e-val: 6.8e-25 | ||
| Factor | e-val(match) | DB |
| SP1 | 0.00000018333 | JASPAR |
| Klf4 | 0.0003735 | JASPAR |
| Pax4 | 0.00073075 | JASPAR |
| PPARG::RXRA | 0.0023937 | JASPAR |
| INSM1 | 0.0040562 | JASPAR |
|
| ||
| Sites: 53/100 | e-val: 0.000000000000037 | ||
| Factor | e-val(match) | DB |
| PLAG1 | 0.00014842 | JASPAR |
| INSM1 | 0.00015119 | JASPAR |
| SP1 | 0.0010156 | JASPAR |
| TFAP2A | 0.0025541 | JASPAR |
| PPARG::RXRA | 0.014852 | JASPAR |
|
| ||
| Sites: 29/100 | e-val: 0.079 | ||
| Factor | e-val(match) | DB |
| PLAG1 | 0.00000030702 | JASPAR |
| TFAP2A | 0.000014781 | JASPAR |
| EBF1 | 0.000036123 | JASPAR |
| Zfp423 | 0.000063176 | JASPAR |
| TP53 | 0.0031318 | JASPAR |