SOM cluster: 1212
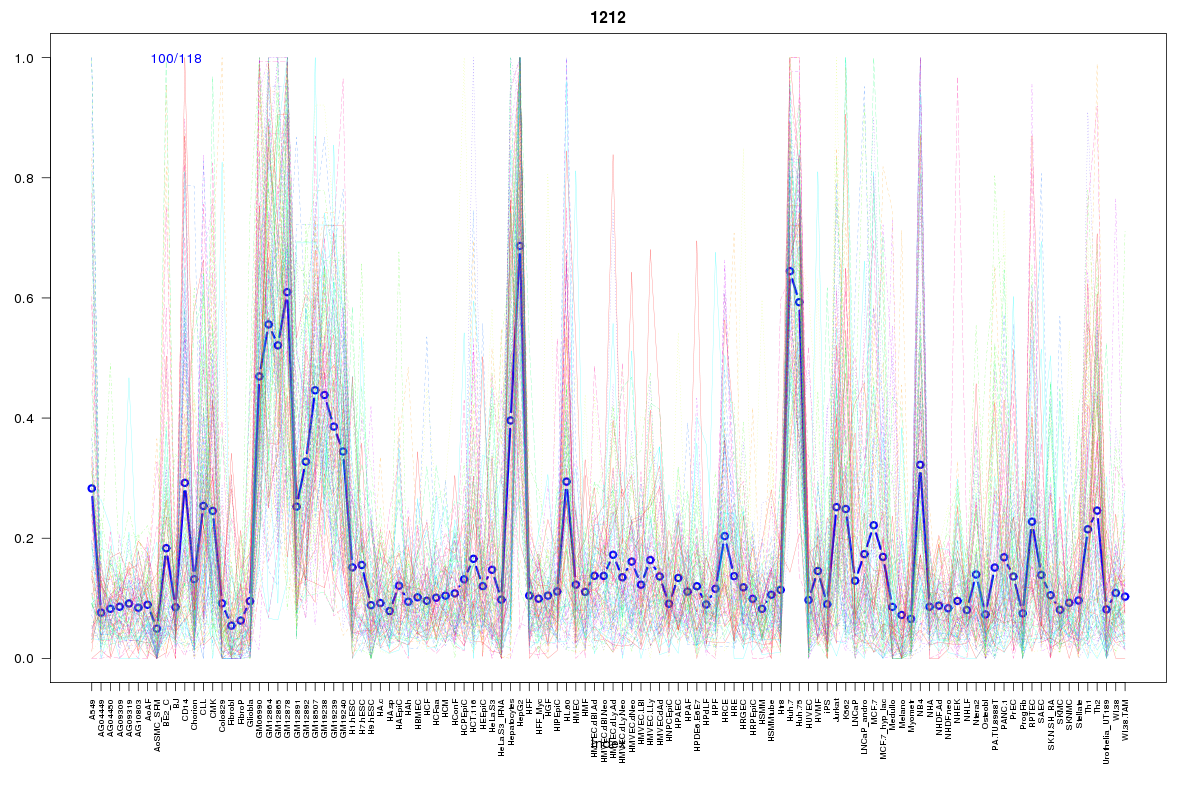
Cluster Hypersensitivity Profile

Genomic Location Trend
These plots show the distribution of the DHS sites surrounding the Transcript Start Site of the nearest gene.
Stats
Number of sites: 118Promoter: 16%
CpG-Island: 9%
Conserved: 42%
Enriched Motifs & Matches
Match Detail: [Jaspar]
|
| ||
|---|---|---|
| Sites: 25/100 | e-val: 0.000022 | ||
| Factor | e-val(match) | DB |
| HNF4A | 3.3307e-16 | JASPAR |
| NR2F1 | 0.0000000000000081046 | JASPAR |
| NR1H2::RXRA | 0.000000000089967 | JASPAR |
| PPARG::RXRA | 0.0000000010433 | JASPAR |
| SOX10 | 0.0016884 | JASPAR |
BED file downloads
Top 10 Example Regions
| Location | Gene Link | Dist. |
|---|---|---|
| chr17: 72732765-72732915 | SLC9A3R1 | 54.75 |
| chr17: 72732765-72732915 | RAB37 | 54.75 |
| chr17: 72732765-72732915 | CD300LF | 54.75 |
| chr20: 30308660-30308810 | TPX2 | 60.52 |
| chr19: 47598580-47598730 | SAE1 | 62.58 |
| chr1: 182994980-182995130 | RP11-505O17.1 | 62.94 |
| chr19: 4539965-4540115 | LRG1 | 66.8 |
| chr20: 37076885-37077035 | SNHG17 | 68.52 |
| chr20: 37076885-37077035 | RP4-564F22.5 | 68.52 |
| chr20: 37076885-37077035 | SNORA71A | 68.52 |