SOM cluster: 1215
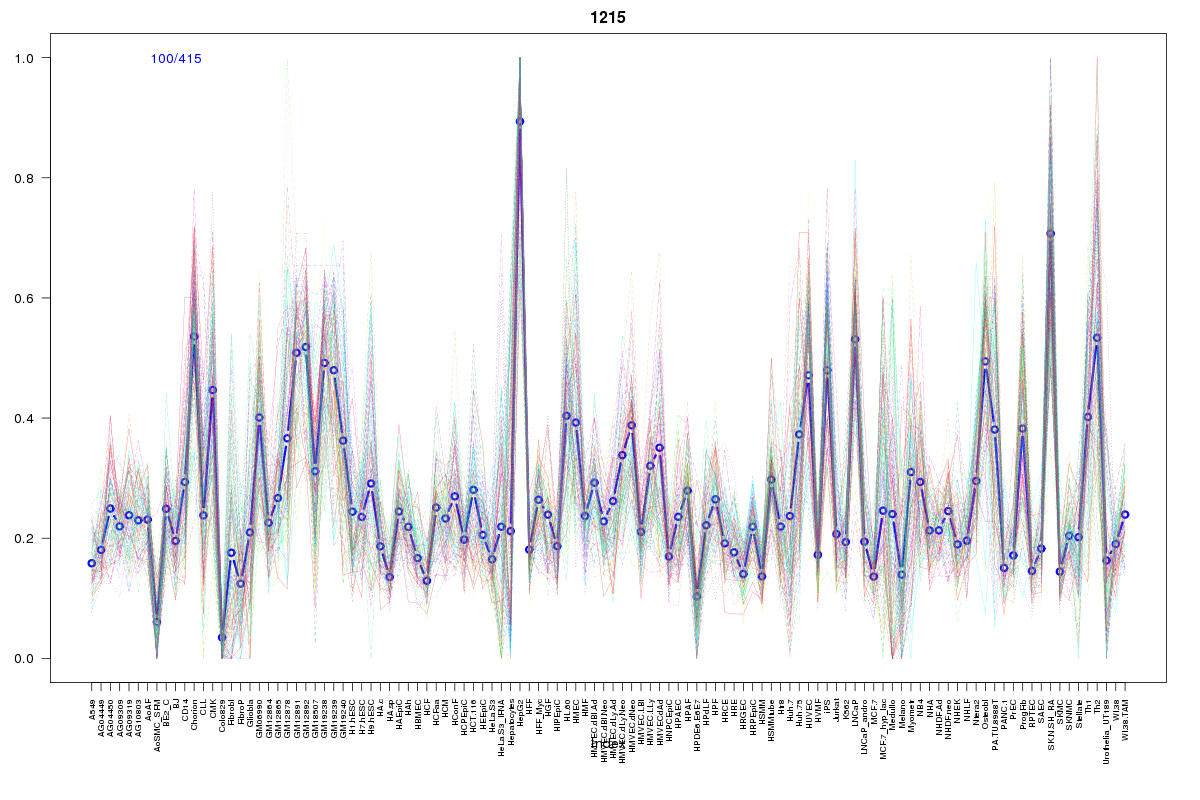
Cluster Hypersensitivity Profile

Genomic Location Trend
These plots show the distribution of the DHS sites surrounding the Transcript Start Site of the nearest gene.
Stats
Number of sites: 415Promoter: 40%
CpG-Island: 81%
Conserved: 88%
Enriched Motifs & Matches
Match Detail: [Jaspar]
|
| ||
|---|---|---|
| Sites: 78/100 | e-val: 0 | ||
| Factor | e-val(match) | DB |
| TFAP2A | 0.0013342 | JASPAR |
| Zfx | 0.012008 | JASPAR |
| SP1 | 0.013314 | JASPAR |
| PLAG1 | 0.030623 | JASPAR |
| E2F1 | 0.053335 | JASPAR |
|
| ||
| Sites: 69/100 | e-val: 9.2e-19 | ||
| Factor | e-val(match) | DB |
| TFAP2A | 0.00010744 | JASPAR |
| SP1 | 0.0015063 | JASPAR |
| Zfx | 0.0045156 | JASPAR |
| REST | 0.020828 | JASPAR |
| NHLH1 | 0.046312 | JASPAR |
BED file downloads
Top 10 Example Regions
| Location | Gene Link | Dist. |
|---|---|---|
| chr12: 133263400-133263550 | RP13-672B3.5 | 39.58 |
| chr12: 133263400-133263550 | POLE | 39.58 |
| chr1: 896125-896275 | SAMD11 | 42.31 |
| chr1: 896125-896275 | RP11-54O7.3 | 42.31 |
| chr10: 22609540-22609690 | RP11-573G6.2 | 42.93 |
| chr9: 130331105-130331255 | FAM129B | 50.32 |
| chr20: 60942085-60942235 | RPS21 | 56.1 |
| chr1: 36788820-36788970 | OSCP1 | 60.33 |
| chr2: 118771040-118771190 | INSIG2 | 60.65 |
| chr8: 121824105-121824255 | SNTB1 | 60.87 |