SOM cluster: 123
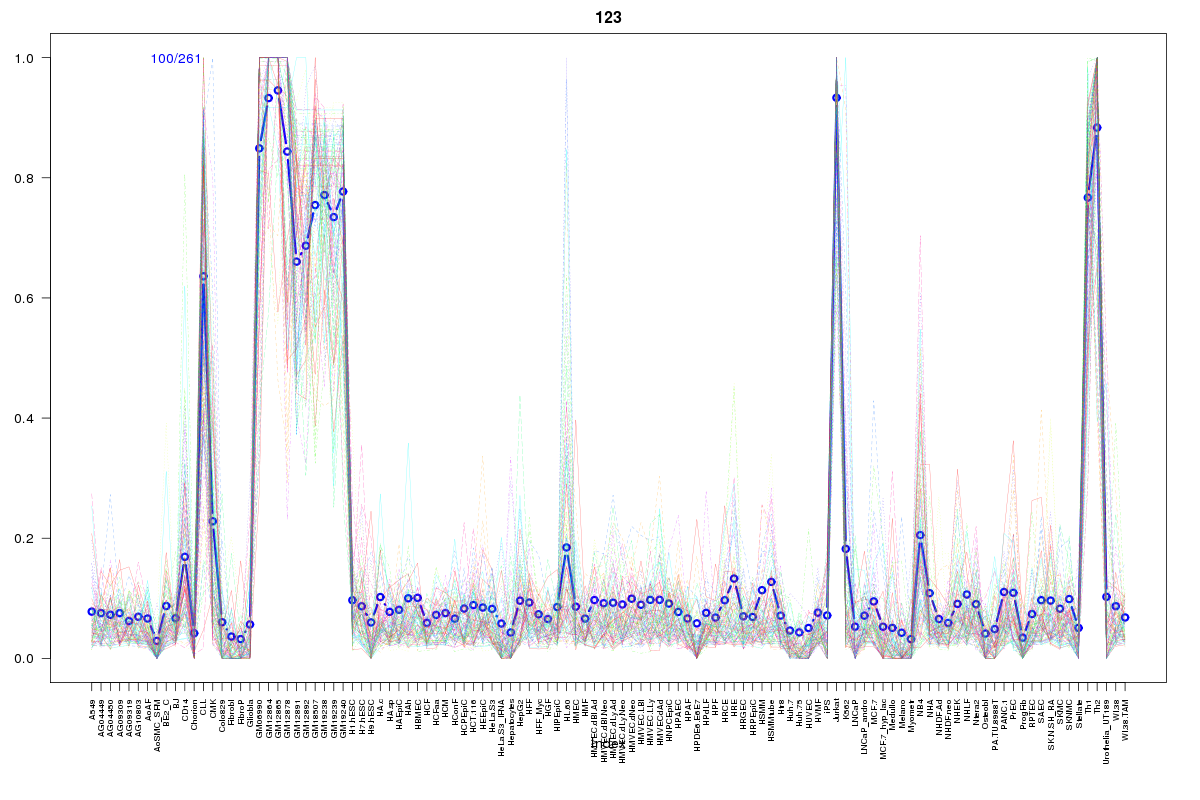
Cluster Hypersensitivity Profile

Genomic Location Trend
These plots show the distribution of the DHS sites surrounding the Transcript Start Site of the nearest gene.
Stats
Number of sites: 261Promoter: 9%
CpG-Island: 2%
Conserved: 49%
Enriched Motifs & Matches
Match Detail: [Jaspar]
|
| ||
|---|---|---|
| Sites: 55/100 | e-val: 7.7e-34 | ||
| Factor | e-val(match) | DB |
| FEV | 0.000000052236 | JASPAR |
| SPI1 | 0.000000052518 | JASPAR |
| ELK4 | 0.000000065388 | JASPAR |
| GABPA | 0.0000033437 | JASPAR |
| SPIB | 0.000011128 | JASPAR |
|
| ||
| Sites: 32/100 | e-val: 0.0089 | ||
| Factor | e-val(match) | DB |
| RUNX1 | 0.0000000015606 | JASPAR |
| RREB1 | 0.000143 | JASPAR |
| ZNF354C | 0.0012929 | JASPAR |
| MYC::MAX | 0.015713 | JASPAR |
| Tcfcp2l1 | 0.017355 | JASPAR |
BED file downloads
Top 10 Example Regions
| Location | Gene Link | Dist. |
|---|---|---|
| chr17: 1726900-1727050 | SERPINF1 | 35.89 |
| chr17: 1726900-1727050 | RPA1 | 35.89 |
| chr17: 1726900-1727050 | SMYD4 | 35.89 |
| chr7: 44121120-44121270 | LINC00957 | 46.34 |
| chr7: 44121120-44121270 | POLM | 46.34 |
| chr7: 44121120-44121270 | AC017116.11 | 46.34 |
| chr7: 44121120-44121270 | DBNL | 46.34 |
| chr7: 44121120-44121270 | AC004951.6 | 46.34 |
| chr7: 44121120-44121270 | AEBP1 | 46.34 |
| chr1: 161511900-161512050 | RPS23P10 | 47.17 |