SOM cluster: 1259
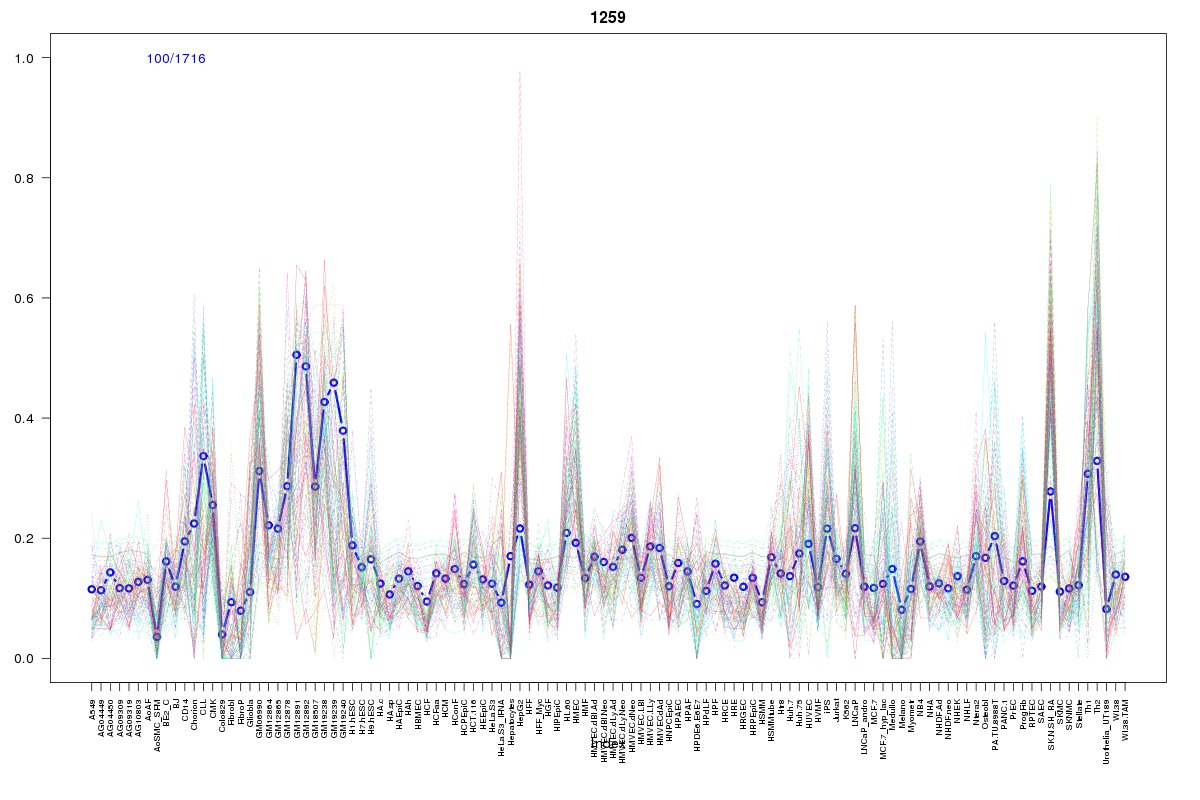
Cluster Hypersensitivity Profile

Genomic Location Trend
These plots show the distribution of the DHS sites surrounding the Transcript Start Site of the nearest gene.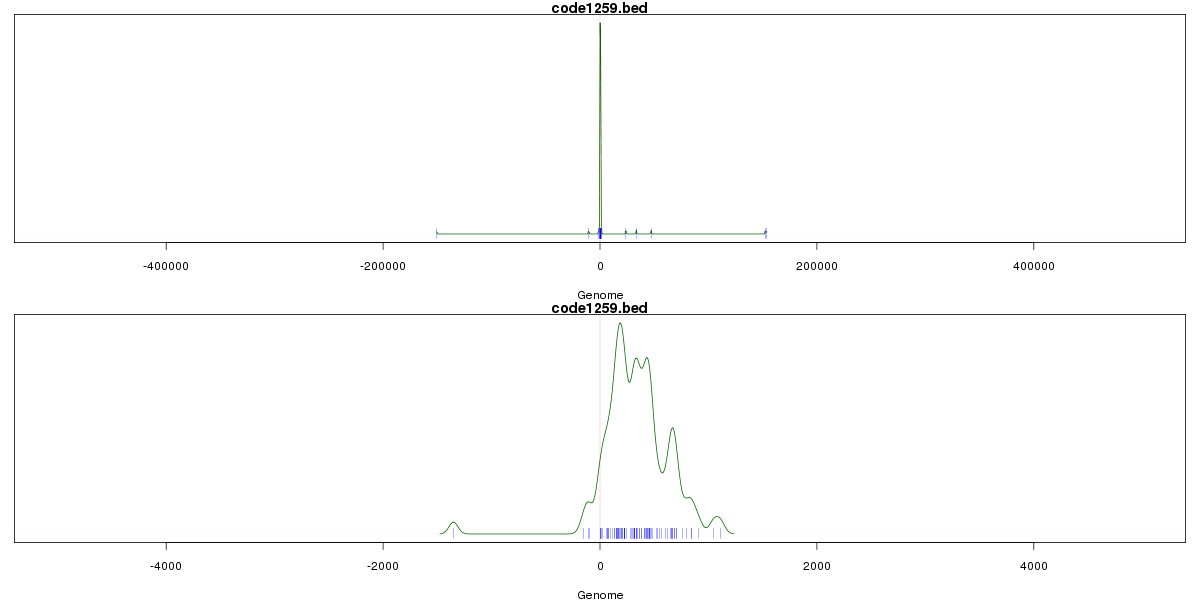
Stats
Number of sites: 1716Promoter: 20%
CpG-Island: 90%
Conserved: 68%
Enriched Motifs & Matches
Match Detail: [Jaspar]
|
| ||
|---|---|---|
| Sites: 99/100 | e-val: 0 | ||
| Factor | e-val(match) | DB |
| SP1 | 0.0000051817 | JASPAR |
| TFAP2A | 0.00019812 | JASPAR |
| Egr1 | 0.0063282 | JASPAR |
| Klf4 | 0.036861 | JASPAR |
| PLAG1 | 0.048641 | JASPAR |
|
| ||
| Sites: 89/100 | e-val: 6.1e-31 | ||
| Factor | e-val(match) | DB |
| TFAP2A | 0.0000015289 | JASPAR |
| SP1 | 0.00010746 | JASPAR |
| NFKB1 | 0.012729 | JASPAR |
| PLAG1 | 0.015867 | JASPAR |
| MZF1_1-4 | 0.038408 | JASPAR |
|
| ||
| Sites: 57/100 | e-val: 0.00000005 | ||
| Factor | e-val(match) | DB |
| SP1 | 0.0000022728 | JASPAR |
| PLAG1 | 0.000039517 | JASPAR |
| TFAP2A | 0.00088405 | JASPAR |
| Pax4 | 0.0089468 | JASPAR |
| MZF1_1-4 | 0.017517 | JASPAR |
BED file downloads
Top 10 Example Regions
| Location | Gene Link | Dist. |
|---|---|---|
| chr10: 88161300-88161450 | WAPAL | 29.68 |
| chr7: 148582000-148582150 | EZH2 | 30.23 |
| chr19: 12267705-12267855 | CTC-359D24.3 | 35.95 |
| chr19: 12267705-12267855 | ZNF625 | 35.95 |
| chr8: 42752280-42752430 | THAP1 | 40.75 |
| chr1: 35586365-35586515 | ZMYM1 | 43.13 |
| chr9: 132265785-132265935 | LINC00963 | 43.52 |
| chr9: 132265785-132265935 | RP11-65J3.2 | 43.52 |
| chr17: 4871665-4871815 | RNF167 | 43.71 |
| chr17: 4871665-4871815 | AC109333.10 | 43.71 |