SOM cluster: 1273
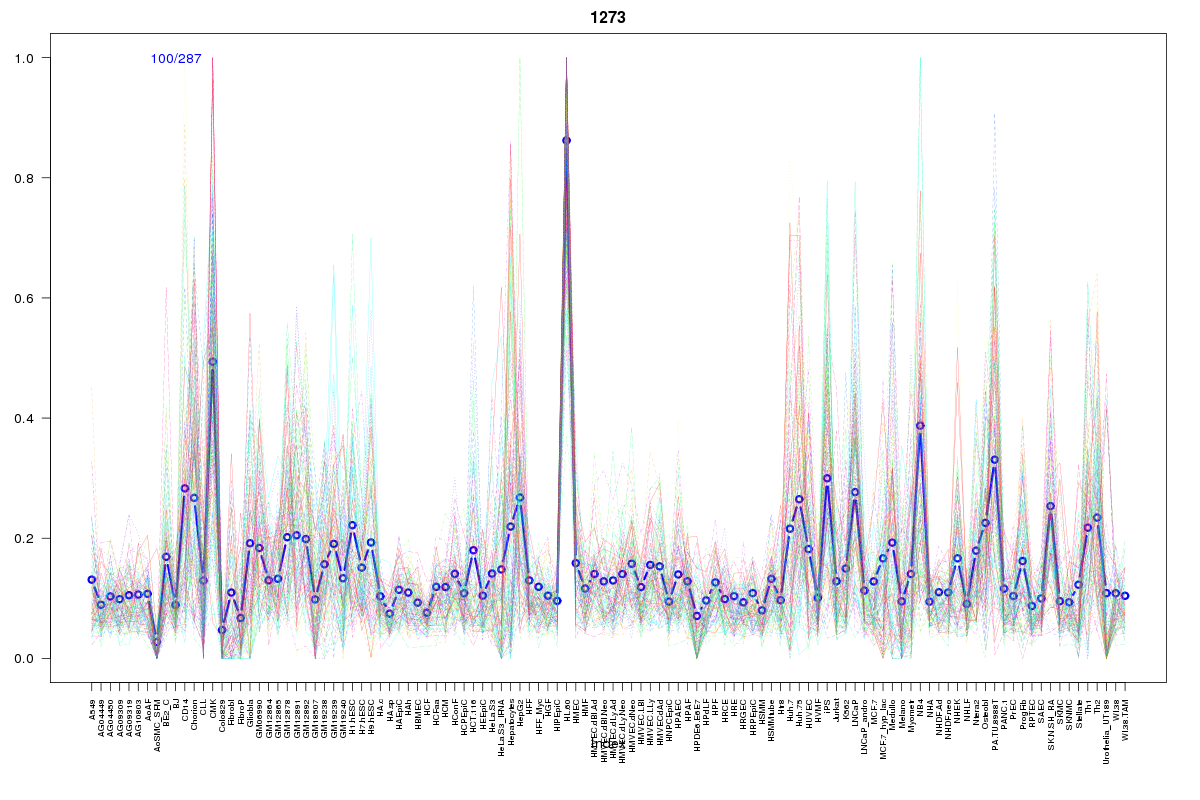
Cluster Hypersensitivity Profile

Genomic Location Trend
These plots show the distribution of the DHS sites surrounding the Transcript Start Site of the nearest gene.
Stats
Number of sites: 287Promoter: 22%
CpG-Island: 49%
Conserved: 44%
Enriched Motifs & Matches
Match Detail: [Jaspar]
|
| ||
|---|---|---|
| Sites: 68/100 | e-val: 5.30001e-40 | ||
| Factor | e-val(match) | DB |
| SP1 | 0.00000076231 | JASPAR |
| TFAP2A | 0.0000072191 | JASPAR |
| RREB1 | 0.0014087 | JASPAR |
| PLAG1 | 0.0045086 | JASPAR |
| Egr1 | 0.0099271 | JASPAR |
|
| ||
| Sites: 68/100 | e-val: 0.000000017 | ||
| Factor | e-val(match) | DB |
| SP1 | 0.000000079139 | JASPAR |
| Klf4 | 0.00024373 | JASPAR |
| TFAP2A | 0.0053734 | JASPAR |
| Egr1 | 0.0067761 | JASPAR |
| RXR::RAR_DR5 | 0.012316 | JASPAR |
|
| ||
| Sites: 32/100 | e-val: 0.0000000053 | ||
| Factor | e-val(match) | DB |
| SP1 | 0.000000000018529 | JASPAR |
| PPARG::RXRA | 0.00000030558 | JASPAR |
| Klf4 | 0.00012233 | JASPAR |
| Tal1::Gata1 | 0.00055137 | JASPAR |
| INSM1 | 0.004484 | JASPAR |
BED file downloads
Top 10 Example Regions
| Location | Gene Link | Dist. |
|---|---|---|
| chr19: 14098120-14098270 | PODNL1 | 42.76 |
| chr19: 14098120-14098270 | hsa-mir-1199 | 42.76 |
| chr11: 67139900-67140050 | POLD4 | 45.13 |
| chr19: 33794285-33794435 | PEPD | 47.23 |
| chr19: 33794285-33794435 | CEBPA-AS1 | 47.23 |
| chr8: 126441280-126441430 | TRIB1 | 48.14 |
| chr20: 62710545-62710695 | SAMD10 | 48.94 |
| chr20: 62710545-62710695 | TCEA2 | 48.94 |
| chr19: 805945-806095 | PALM | 50.33 |
| chr17: 29037065-29037215 | AC005562.1 | 50.64 |