SOM cluster: 1293
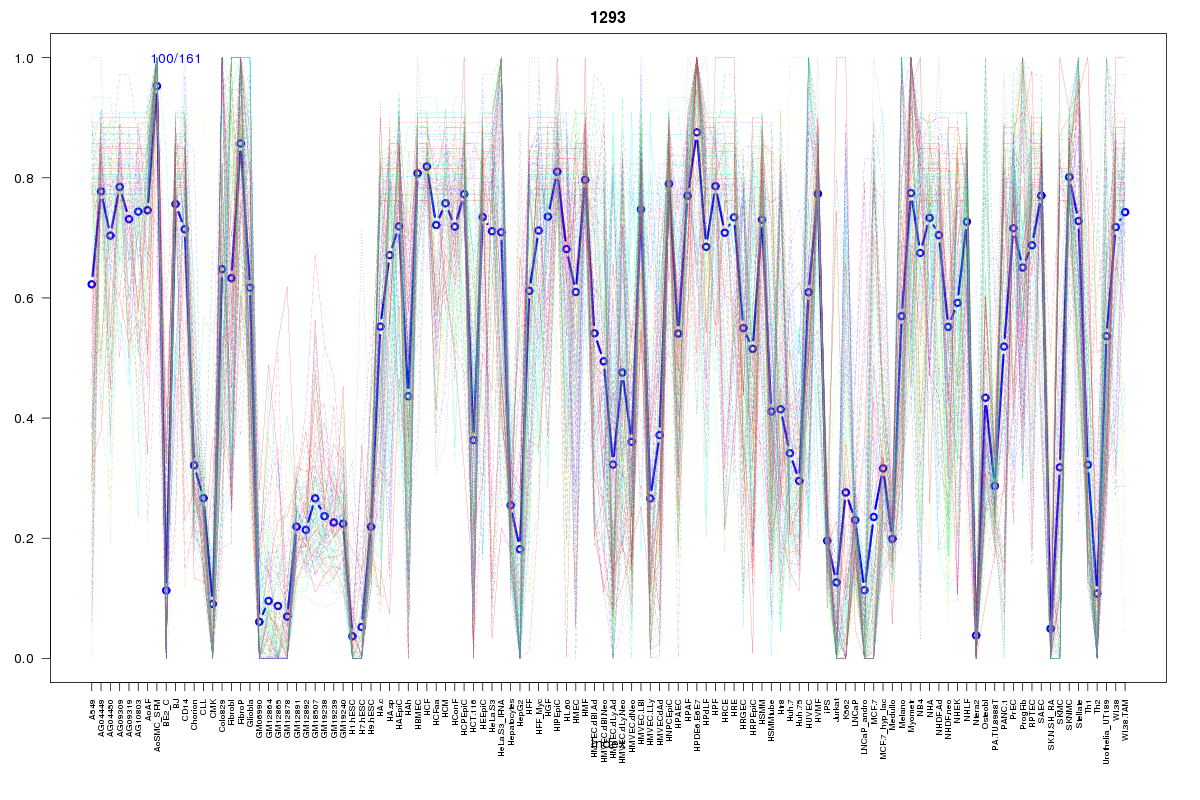
Cluster Hypersensitivity Profile

Genomic Location Trend
These plots show the distribution of the DHS sites surrounding the Transcript Start Site of the nearest gene.
Stats
Number of sites: 161Promoter: 2%
CpG-Island: 2%
Conserved: 53%
Enriched Motifs & Matches
Match Detail: [Jaspar]
|
| ||
|---|---|---|
| Sites: 56/100 | e-val: 2.1e-37 | ||
| Factor | e-val(match) | DB |
| AP1 | 0.000000000092749 | JASPAR |
| NFE2L2 | 0.00000000014712 | JASPAR |
| NFE2L1::MafG | 0.000048889 | JASPAR |
| PBX1 | 0.0020504 | JASPAR |
| Pax2 | 0.0090423 | JASPAR |
|
| ||
| Sites: 38/100 | e-val: 0.00000021 | ||
| Factor | e-val(match) | DB |
| CEBPA | 0.0000000058605 | JASPAR |
| HLF | 0.0000043418 | JASPAR |
| Pou5f1 | 0.000028374 | JASPAR |
| Sox2 | 0.000053234 | JASPAR |
| NFIL3 | 0.00032869 | JASPAR |
BED file downloads
Top 10 Example Regions
| Location | Gene Link | Dist. |
|---|---|---|
| chr4: 90391340-90391490 | RP11-115D19.1 | 40.22 |
| chr1: 198850460-198850610 | MIR181A1HG | 45.47 |
| chr1: 21780560-21780710 | NBPF3 | 48.55 |
| chr9: 115950360-115950510 | SLC31A2 | 52.43 |
| chr3: 133961640-133961790 | RYK | 56.13 |
| chr10: 24995480-24995630 | ARHGAP21 | 58.67 |
| chr11: 95901960-95902110 | MAML2 | 59.23 |
| chr8: 40030505-40030655 | C8orf4 | 59.95 |
| chr20: 43205640-43205790 | TTPAL | 64.69 |
| chr20: 43205640-43205790 | SERINC3 | 64.69 |