SOM cluster: 1301
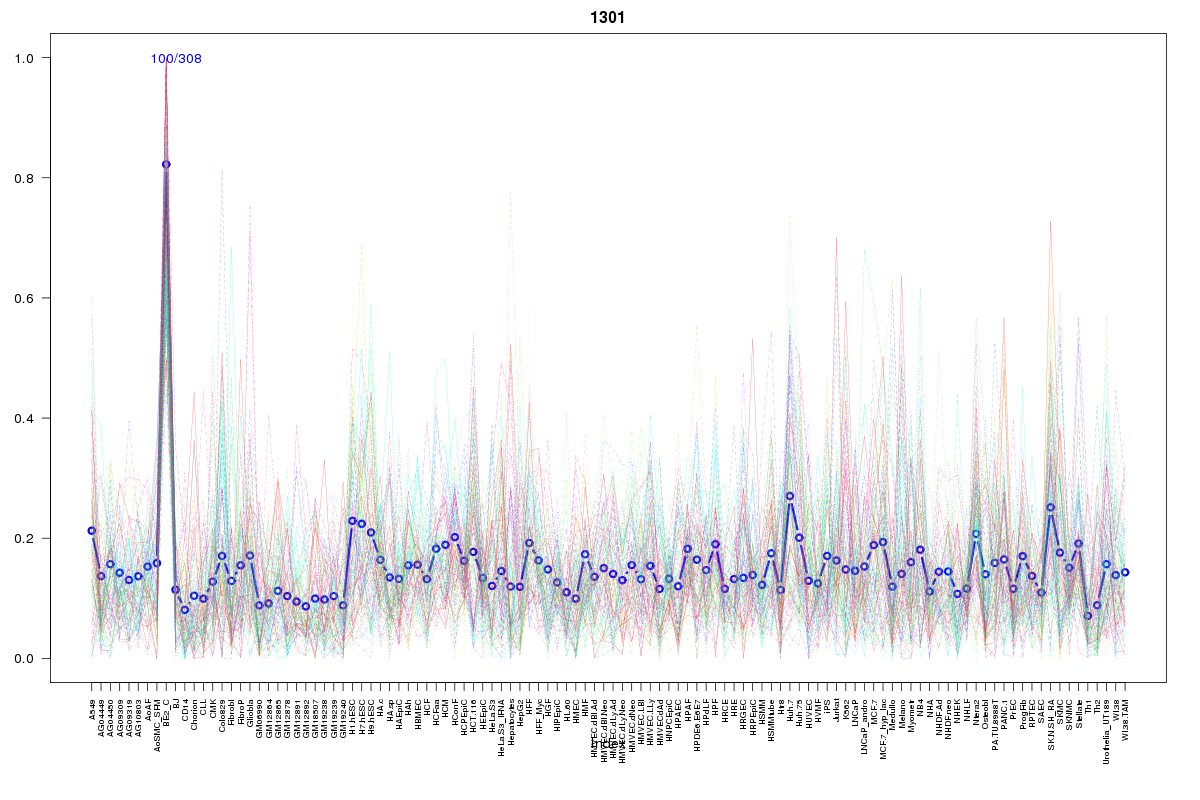
Cluster Hypersensitivity Profile

Genomic Location Trend
These plots show the distribution of the DHS sites surrounding the Transcript Start Site of the nearest gene.
Stats
Number of sites: 308Promoter: 7%
CpG-Island: 3%
Conserved: 42%
Enriched Motifs & Matches
Match Detail: [Jaspar]
|
| ||
|---|---|---|
| Sites: 35/100 | e-val: 0.0000021 | ||
| Factor | e-val(match) | DB |
| CTCF | 0.000000000000024536 | JASPAR |
| INSM1 | 0.00033329 | JASPAR |
| TAL1::TCF3 | 0.0018142 | JASPAR |
| SP1 | 0.0030888 | JASPAR |
| ELK4 | 0.013698 | JASPAR |
BED file downloads
Top 10 Example Regions
| Location | Gene Link | Dist. |
|---|---|---|
| chr1: 197886100-197886250 | LHX9 | 36.43 |
| chr1: 197886100-197886250 | C1orf53 | 36.43 |
| chr1: 203123760-203123910 | RP11-335O13.8 | 47.84 |
| chr9: 2242520-2242670 | SMARCA2 | 52.12 |
| chr2: 30644660-30644810 | LCLAT1 | 53.8 |
| chr15: 74470505-74470655 | RP11-60L3.1 | 55.98 |
| chr15: 74470505-74470655 | STRA6 | 55.98 |
| chr7: 107735660-107735810 | NRCAM | 57.62 |
| chr2: 65298720-65298870 | RNU6-548P | 58.47 |
| chr8: 105235280-105235430 | RIMS2 | 60.94 |