SOM cluster: 1305
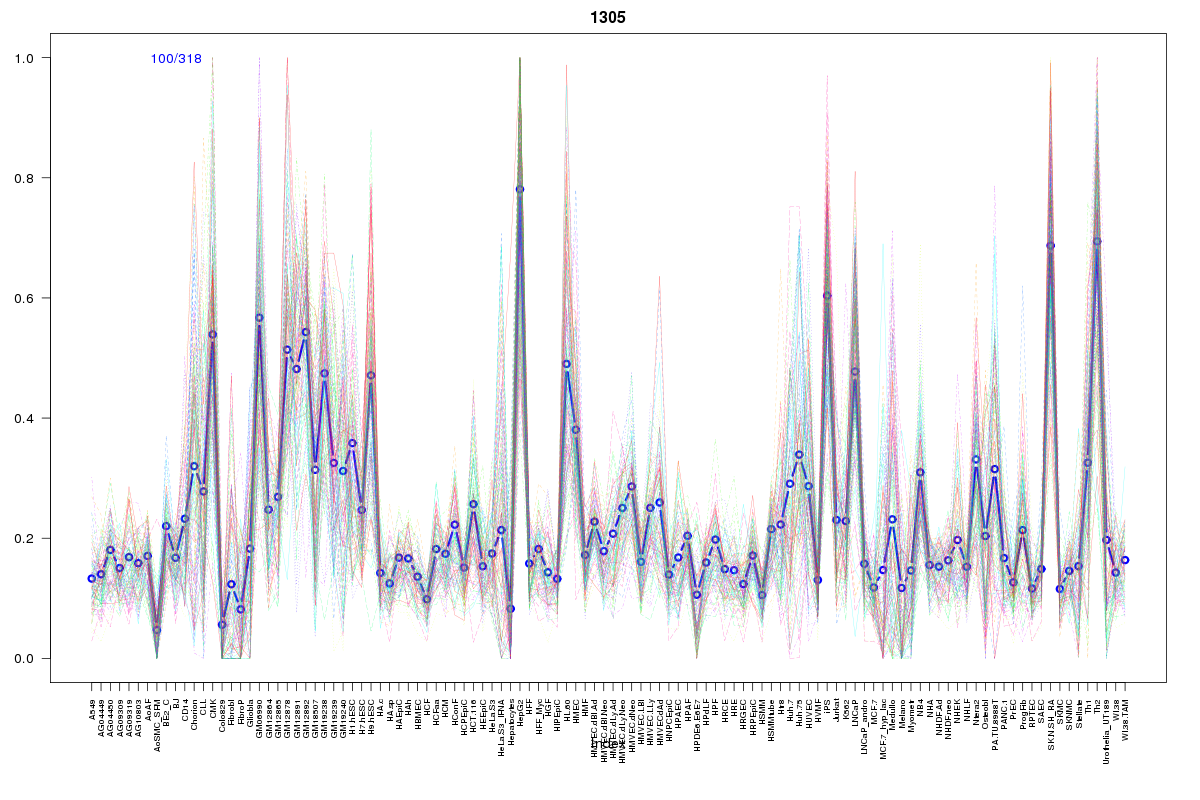
Cluster Hypersensitivity Profile

Genomic Location Trend
These plots show the distribution of the DHS sites surrounding the Transcript Start Site of the nearest gene.
Stats
Number of sites: 318Promoter: 26%
CpG-Island: 96%
Conserved: 68%
Enriched Motifs & Matches
Match Detail: [Jaspar]
|
| ||
|---|---|---|
| Sites: 95/100 | e-val: 0 | ||
| Factor | e-val(match) | DB |
| SP1 | 0.00006845 | JASPAR |
| TFAP2A | 0.0001028 | JASPAR |
| PLAG1 | 0.00015485 | JASPAR |
| RXR::RAR_DR5 | 0.033695 | JASPAR |
| Klf4 | 0.050636 | JASPAR |
|
| ||
| Sites: 86/100 | e-val: 0 | ||
| Factor | e-val(match) | DB |
| SP1 | 0.000021344 | JASPAR |
| TFAP2A | 0.0032161 | JASPAR |
| PLAG1 | 0.0059517 | JASPAR |
| RREB1 | 0.0064913 | JASPAR |
| Klf4 | 0.0087634 | JASPAR |
|
| ||
| Sites: 65/100 | e-val: 0.0000000000021 | ||
| Factor | e-val(match) | DB |
| SP1 | 0.0000046996 | JASPAR |
| Egr1 | 0.00001881 | JASPAR |
| TFAP2A | 0.000030443 | JASPAR |
| Klf4 | 0.0042291 | JASPAR |
| PLAG1 | 0.0051514 | JASPAR |
BED file downloads
Top 10 Example Regions
| Location | Gene Link | Dist. |
|---|---|---|
| chr1: 149982365-149982515 | MTMR11 | 28.45 |
| chr11: 14665920-14666070 | PDE3B | 37.64 |
| chr9: 131315160-131315310 | VTI1BP4 | 47.42 |
| chr13: 113863120-113863270 | LAMP1 | 48.86 |
| chr11: 64880305-64880455 | VPS51 | 53.12 |
| chr11: 64880305-64880455 | CDCA5 | 53.12 |
| chr11: 64880305-64880455 | FAU | 53.12 |
| chr11: 64880305-64880455 | TM7SF2 | 53.12 |
| chr11: 63953765-63953915 | RP11-783K16.5 | 58.93 |
| chr11: 63953765-63953915 | PPP1R14B | 58.93 |