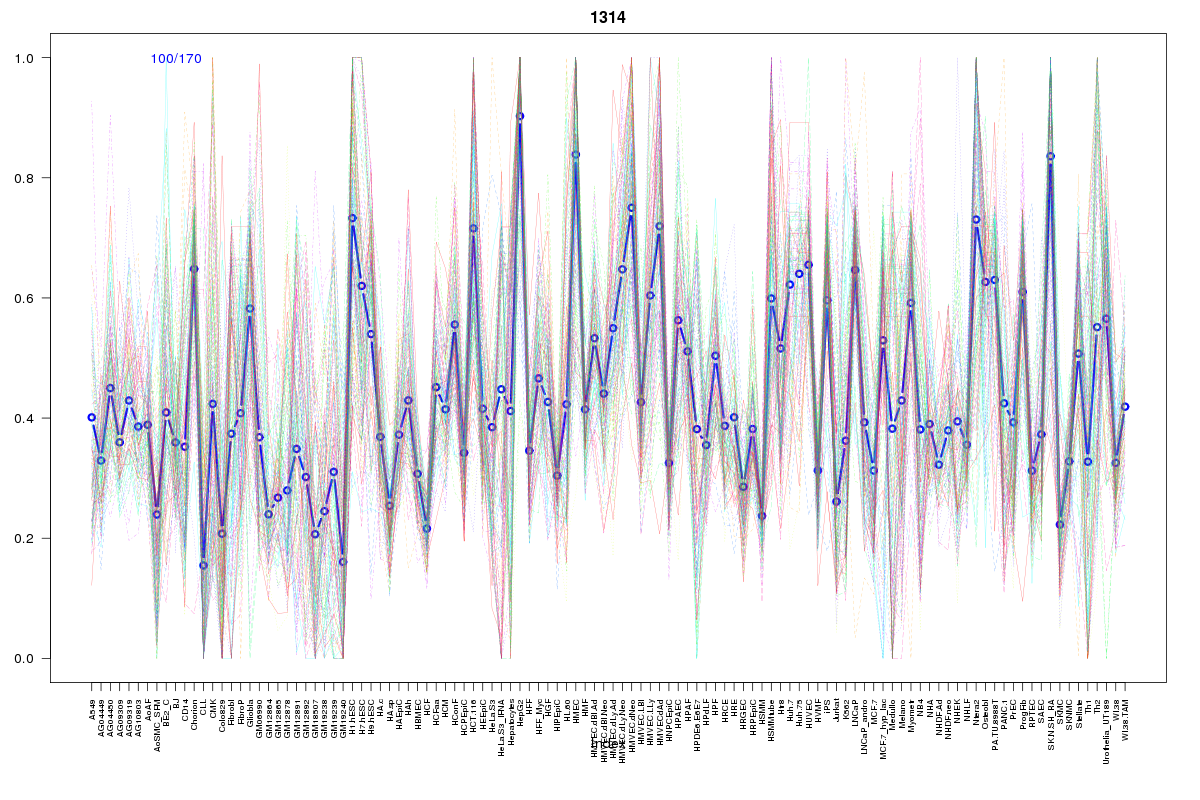
SOM cluster: 1314
Cluster Hypersensitivity Profile

Genomic Location Trend
These plots show the distribution of the DHS sites surrounding the Transcript Start Site of the nearest gene.
Stats
Number of sites: 170Promoter: 61%
CpG-Island: 89%
Conserved: 86%
Enriched Motifs & Matches
Match Detail: [Jaspar]
|
| ||
|---|---|---|
| Sites: 98/100 | e-val: 0 | ||
| Factor | e-val(match) | DB |
| SP1 | 0.0000029733 | JASPAR |
| Egr1 | 0.00035226 | JASPAR |
| TFAP2A | 0.0017305 | JASPAR |
| Klf4 | 0.0029072 | JASPAR |
| PLAG1 | 0.016419 | JASPAR |
|
| ||
| Sites: 83/100 | e-val: 0 | ||
| Factor | e-val(match) | DB |
| SP1 | 0.00018072 | JASPAR |
| TFAP2A | 0.00068968 | JASPAR |
| PLAG1 | 0.004218 | JASPAR |
| Egr1 | 0.018622 | JASPAR |
| RREB1 | 0.040998 | JASPAR |
|
| ||
| Sites: 58/100 | e-val: 0.0000000049 | ||
| Factor | e-val(match) | DB |
| SP1 | 0.0000001662 | JASPAR |
| Klf4 | 0.00079495 | JASPAR |
| Egr1 | 0.0011515 | JASPAR |
| PLAG1 | 0.01028 | JASPAR |
| ELK4 | 0.034853 | JASPAR |
BED file downloads
Top 10 Example Regions
| Location | Gene Link | Dist. |
|---|---|---|
| chr3: 184080300-184080450 | FAM131A | 39.98 |
| chr3: 184080300-184080450 | POLR2H | 39.98 |
| chr12: 109124380-109124530 | CORO1C | 43.21 |
| chr3: 159481640-159481790 | IQCJ-SCHIP1 | 44.33 |
| chr2: 102003800-102003950 | AC092570.2 | 50.56 |
| chr11: 123525320-123525470 | ZNF202 | 51.16 |
| chr11: 123525320-123525470 | SCN3B | 51.16 |
| chr1: 204121260-204121410 | ETNK2 | 51.55 |
| chr17: 74379245-74379395 | AANAT | 52.71 |
| chr17: 74379245-74379395 | PRPSAP1 | 52.71 |