SOM cluster: 1344
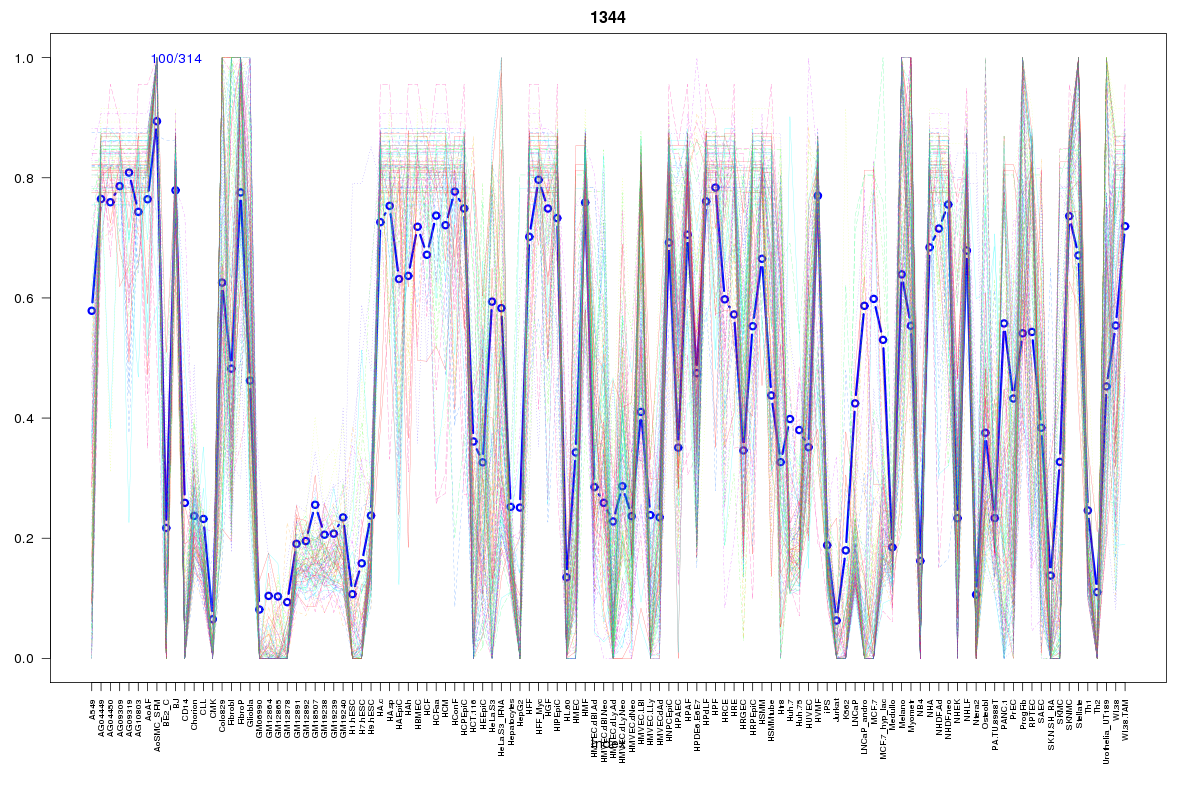
Cluster Hypersensitivity Profile

Genomic Location Trend
These plots show the distribution of the DHS sites surrounding the Transcript Start Site of the nearest gene.
Stats
Number of sites: 314Promoter: 1%
CpG-Island: 0%
Conserved: 59%
Enriched Motifs & Matches
Match Detail: [Jaspar]
|
| ||
|---|---|---|
| Sites: 47/100 | e-val: 0.0000000000026 | ||
| Factor | e-val(match) | DB |
| AP1 | 0.0000000060061 | JASPAR |
| NFE2L2 | 0.00000003501 | JASPAR |
| NFE2L1::MafG | 0.00010236 | JASPAR |
| PBX1 | 0.013998 | JASPAR |
| Pax2 | 0.032704 | JASPAR |
BED file downloads
Top 10 Example Regions
| Location | Gene Link | Dist. |
|---|---|---|
| chr1: 183204200-183204350 | LAMC1 | 36.94 |
| chr1: 183204200-183204350 | RP11-548N1.1 | 36.94 |
| chr3: 46169140-46169290 | CCR1 | 46.6 |
| chr1: 51730260-51730410 | TTC39A | 48.35 |
| chr1: 51730260-51730410 | RNF11 | 48.35 |
| chr1: 51730260-51730410 | snoU13 | 48.35 |
| chr7: 55154120-55154270 | EGFR | 49.37 |
| chr7: 55154120-55154270 | EGFR-AS1 | 49.37 |
| chr6: 161856000-161856150 | PARK2 | 53.86 |
| chr8: 18611320-18611470 | PSD3 | 54.23 |