SOM cluster: 1363
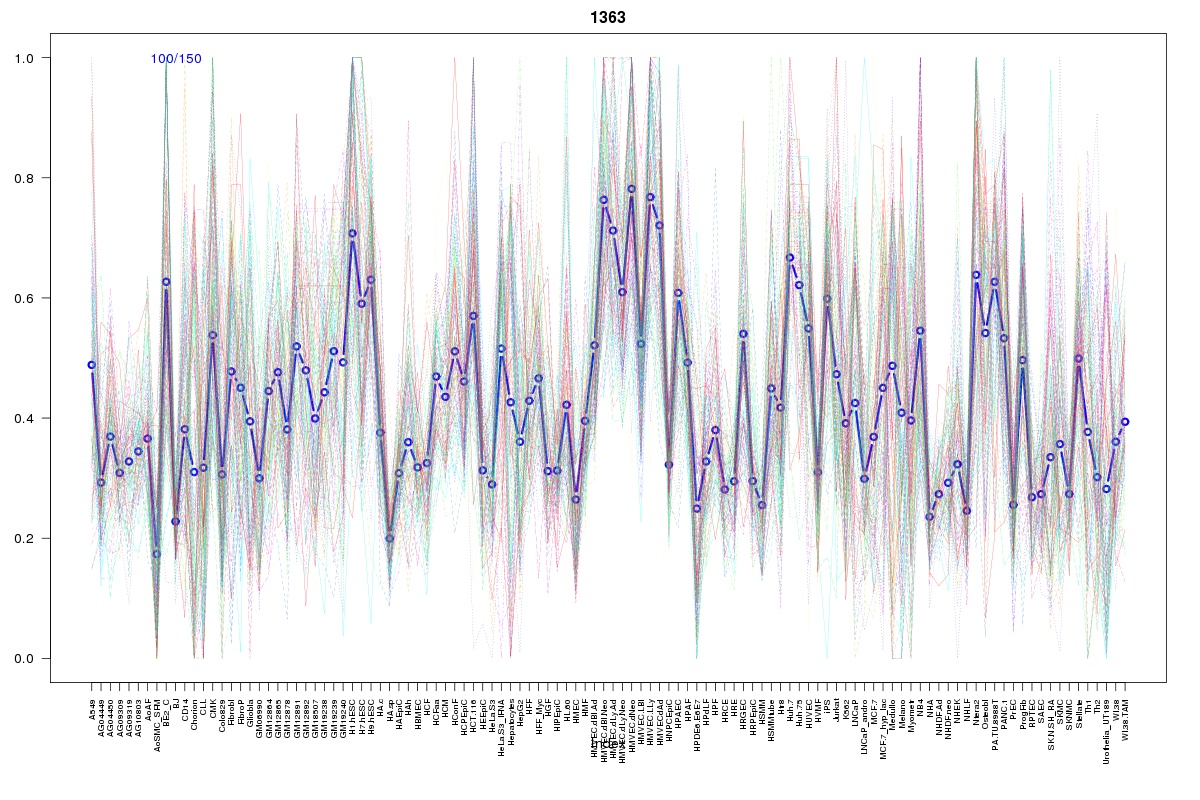
Cluster Hypersensitivity Profile

Genomic Location Trend
These plots show the distribution of the DHS sites surrounding the Transcript Start Site of the nearest gene.
Stats
Number of sites: 150Promoter: 4%
CpG-Island: 4%
Conserved: 47%
Enriched Motifs & Matches
Match Detail: [Jaspar]
|
| ||
|---|---|---|
| Sites: 87/100 | e-val: 0 | ||
| Factor | e-val(match) | DB |
| CTCF | 0 | JASPAR |
| INSM1 | 0.000001332 | JASPAR |
| Zfp423 | 0.00050384 | JASPAR |
| PLAG1 | 0.0010566 | JASPAR |
| SP1 | 0.0014809 | JASPAR |
BED file downloads
Top 10 Example Regions
| Location | Gene Link | Dist. |
|---|---|---|
| chr7: 132265500-132265650 | PLXNA4 | 58.18 |
| chr9: 116725400-116725550 | AMBP | 58.66 |
| chr9: 116725400-116725550 | ZNF618 | 58.66 |
| chr19: 4523405-4523555 | SEMA6B | 62.99 |
| chr19: 4523405-4523555 | UBXN6 | 62.99 |
| chr19: 480260-480410 | SHC2 | 67.42 |
| chr19: 480260-480410 | TPGS1 | 67.42 |
| chr19: 480260-480410 | C2CD4C | 67.42 |
| chr19: 480260-480410 | CDC34 | 67.42 |
| chr12: 56600420-56600570 | COQ10A | 73.14 |