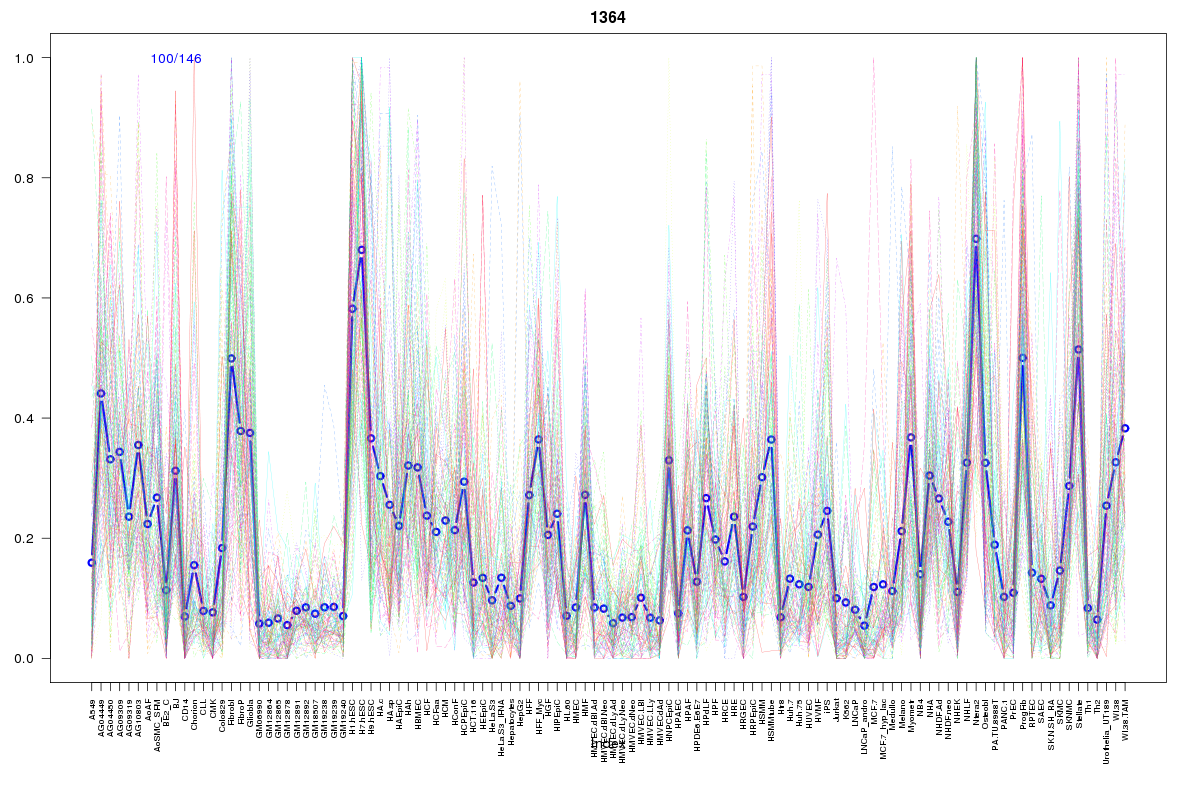
SOM cluster: 1364
Cluster Hypersensitivity Profile

Genomic Location Trend
These plots show the distribution of the DHS sites surrounding the Transcript Start Site of the nearest gene.
Stats
Number of sites: 146Promoter: 7%
CpG-Island: 5%
Conserved: 33%
Enriched Motifs & Matches
Match Detail: [Jaspar]
|
| ||
|---|---|---|
| Sites: 35/100 | e-val: 0.0019 | ||
| Factor | e-val(match) | DB |
| SP1 | 0.00000076205 | JASPAR |
| MZF1_5-13 | 0.0017862 | JASPAR |
| EWSR1-FLI1 | 0.0024217 | JASPAR |
| Pax4 | 0.0026671 | JASPAR |
| RXR::RAR_DR5 | 0.0069682 | JASPAR |
|
| ||
| Sites: 19/100 | e-val: 0.23 | ||
| Factor | e-val(match) | DB |
| AP1 | 0.000000022546 | JASPAR |
| NFE2L2 | 0.0000069394 | JASPAR |
| NFE2L1::MafG | 0.00061084 | JASPAR |
| T | 0.00064161 | JASPAR |
| PPARG | 0.0026077 | JASPAR |
BED file downloads
Top 10 Example Regions
| Location | Gene Link | Dist. |
|---|---|---|
| chr1: 156634340-156634490 | NES | 57.08 |
| chr1: 156634340-156634490 | RRNAD1 | 57.08 |
| chr13: 38444560-38444710 | TRPC4 | 61.77 |
| chr3: 156468820-156468970 | LINC00886 | 63.8 |
| chr11: 126870625-126870775 | RP11-688I9.4 | 63.81 |
| chr11: 126870625-126870775 | RP11-688I9.2 | 63.81 |
| chr11: 126870625-126870775 | KIRREL3 | 63.81 |
| chr11: 131449825-131449975 | NTM | 64.14 |
| chr1: 115632740-115632890 | TSPAN2 | 67.46 |
| chr1: 103572640-103572790 | COL11A1 | 72.82 |