SOM cluster: 137
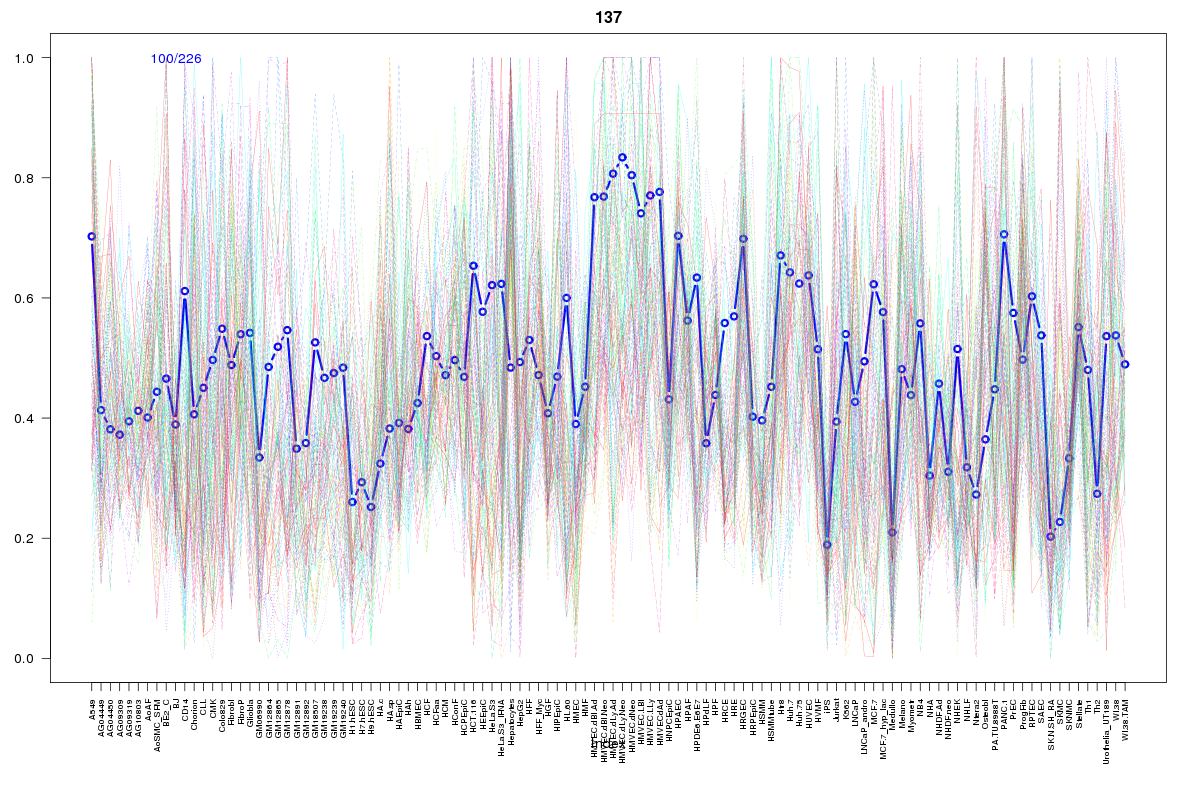
Cluster Hypersensitivity Profile

Genomic Location Trend
These plots show the distribution of the DHS sites surrounding the Transcript Start Site of the nearest gene.
Stats
Number of sites: 226Promoter: 32%
CpG-Island: 20%
Conserved: 59%
Enriched Motifs & Matches
Match Detail: [Jaspar]
|
| ||
|---|---|---|
| Sites: 50/100 | e-val: 0.014 | ||
| Factor | e-val(match) | DB |
| SP1 | 0.00000094086 | JASPAR |
| Pax4 | 0.00017436 | JASPAR |
| EWSR1-FLI1 | 0.0020656 | JASPAR |
| MZF1_5-13 | 0.0055962 | JASPAR |
| SPIB | 0.0098865 | JASPAR |
BED file downloads
Top 10 Example Regions
| Location | Gene Link | Dist. |
|---|---|---|
| chr1: 208021680-208021830 | CD46 | 38.23 |
| chr17: 62159580-62159730 | ERN1 | 40.33 |
| chr3: 159482220-159482370 | IQCJ-SCHIP1 | 51.42 |
| chr1: 145039040-145039190 | PDE4DIP | 52.51 |
| chr1: 145039040-145039190 | SEC22B | 52.51 |
| chr17: 68164280-68164430 | KCNJ2 | 53.63 |
| chr9: 132250220-132250370 | RP11-65J3.3 | 57.69 |
| chr10: 124767420-124767570 | IKZF5 | 57.9 |
| chr12: 107349025-107349175 | C12orf23 | 58.03 |
| chr3: 129346280-129346430 | RHO | 58.17 |