SOM cluster: 1383
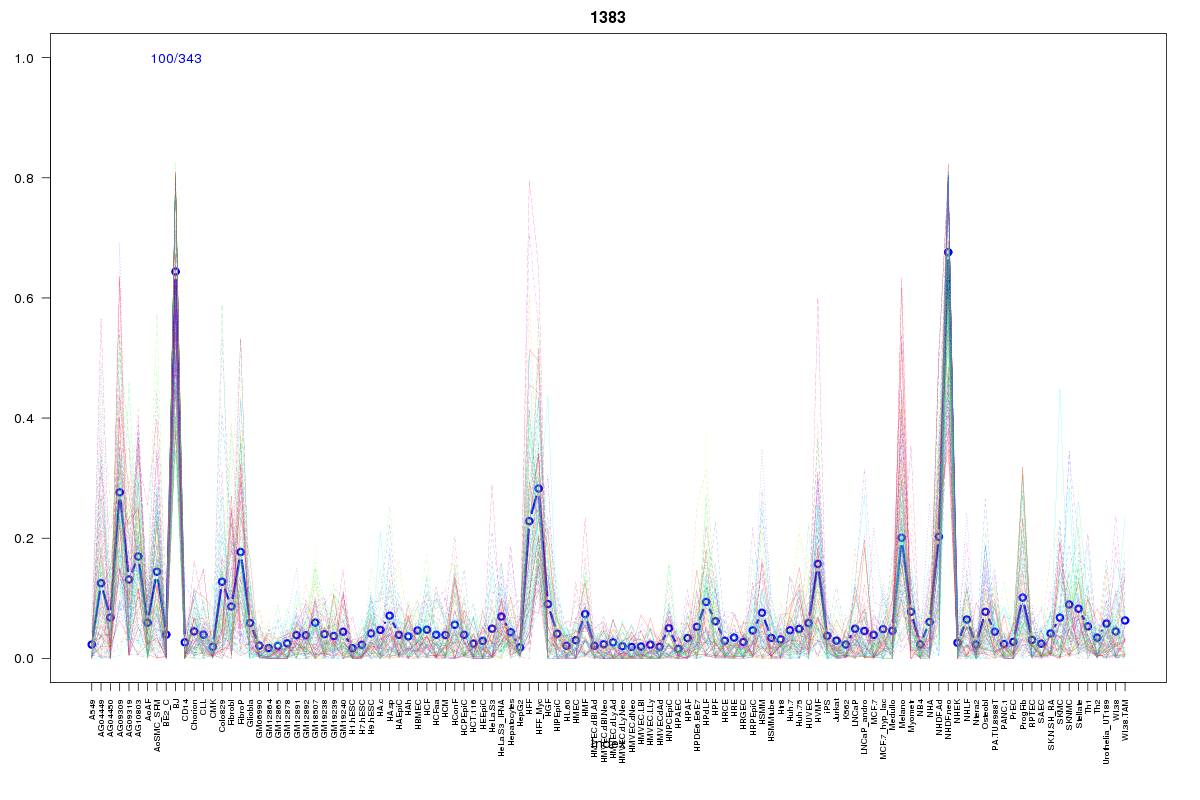
Cluster Hypersensitivity Profile

Genomic Location Trend
These plots show the distribution of the DHS sites surrounding the Transcript Start Site of the nearest gene.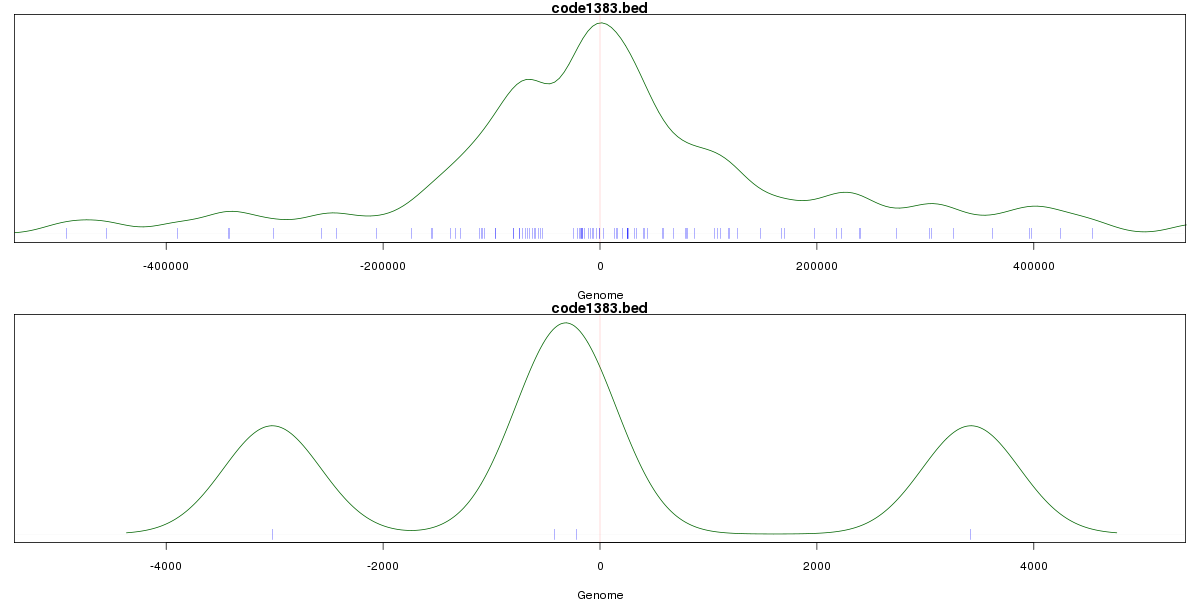
Stats
Number of sites: 343Promoter: 2%
CpG-Island: 0%
Conserved: 56%
Enriched Motifs & Matches
Match Detail: [Jaspar]
|
| ||
|---|---|---|
| Sites: 74/100 | e-val: 0 | ||
| Factor | e-val(match) | DB |
| Foxq1 | 0.0042361 | JASPAR |
| MEF2A | 0.0078427 | JASPAR |
| HNF1A | 0.0080808 | JASPAR |
| Foxd3 | 0.0082409 | JASPAR |
| HNF1B | 0.010934 | JASPAR |
|
| ||
| Sites: 47/100 | e-val: 0.000000034 | ||
| Factor | e-val(match) | DB |
| Foxq1 | 0.0013784 | JASPAR |
| HNF1A | 0.0054118 | JASPAR |
| Foxd3 | 0.0080117 | JASPAR |
| HNF1B | 0.0091579 | JASPAR |
| Pax4 | 0.017497 | JASPAR |
|
| ||
| Sites: 31/100 | e-val: 0.69 | ||
| Factor | e-val(match) | DB |
| Foxd3 | 0.000014214 | JASPAR |
| ARID3A | 0.0014722 | JASPAR |
| Foxq1 | 0.0043759 | JASPAR |
| Lhx3 | 0.011679 | JASPAR |
| Nkx2-5 | 0.023595 | JASPAR |
BED file downloads
Top 10 Example Regions
| Location | Gene Link | Dist. |
|---|---|---|
| chr5: 72703800-72703950 | RP11-79P5.2 | 58.47 |
| chr5: 72703800-72703950 | BTF3 | 58.47 |
| chr8: 36758520-36758670 | AC090453.1 | 61.5 |
| chr4: 100155820-100155970 | RP11-696N14.1 | 66.62 |
| chr3: 42786940-42787090 | ZBTB47 | 70.36 |
| chr22: 45851200-45851350 | FBLN1 | 74.56 |
| chr3: 24555100-24555250 | THRB-IT1 | 74.68 |
| chr17: 67946260-67946410 | AC002539.1 | 77.13 |
| chr12: 125240860-125241010 | SCARB1 | 80.37 |
| chr4: 39546300-39546450 | LIAS | 82.41 |