SOM cluster: 1423
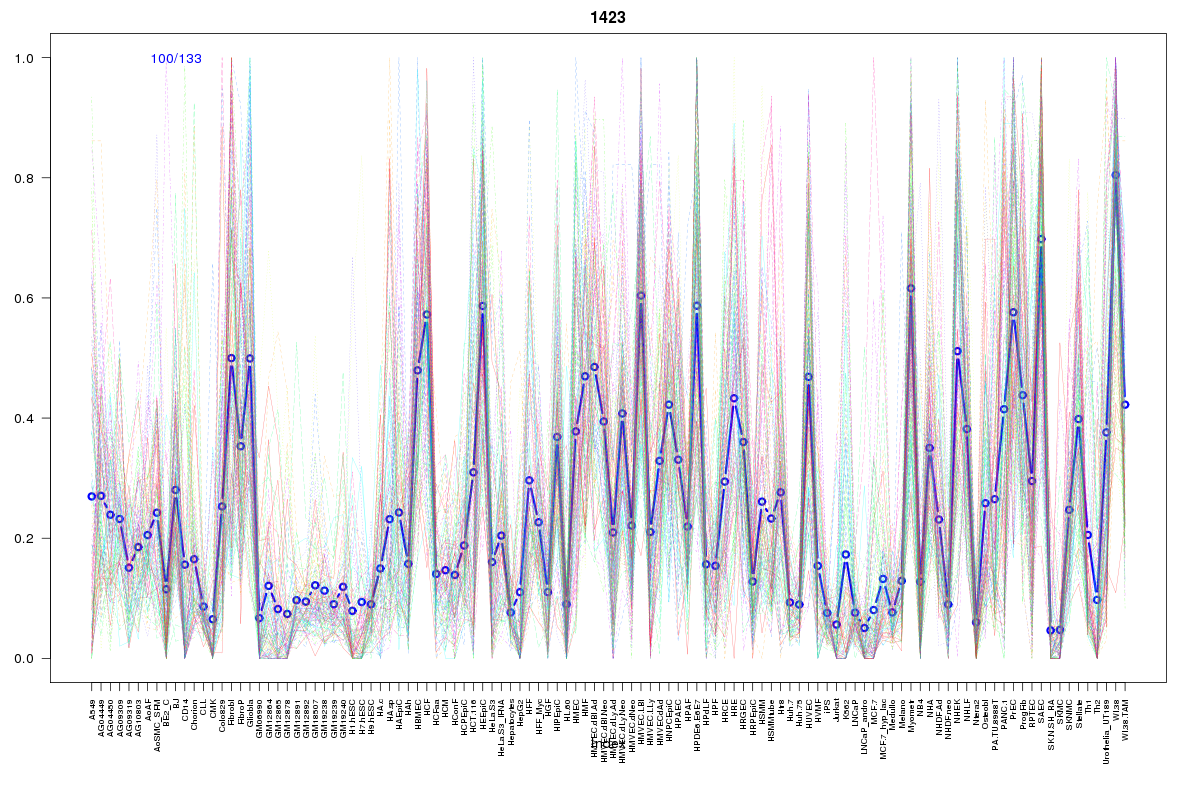
Cluster Hypersensitivity Profile

Genomic Location Trend
These plots show the distribution of the DHS sites surrounding the Transcript Start Site of the nearest gene.
Stats
Number of sites: 133Promoter: 7%
CpG-Island: 0%
Conserved: 28%
Enriched Motifs & Matches
Match Detail: [Jaspar]
|
| ||
|---|---|---|
| Sites: 61/100 | e-val: 3.4e-31 | ||
| Factor | e-val(match) | DB |
| NFE2L2 | 0.000000001049 | JASPAR |
| AP1 | 0.000000073844 | JASPAR |
| Pax2 | 0.0045517 | JASPAR |
| NFE2L1::MafG | 0.0063421 | JASPAR |
| NR4A2 | 0.022047 | JASPAR |
BED file downloads
Top 10 Example Regions
| Location | Gene Link | Dist. |
|---|---|---|
| chr8: 52782640-52782790 | RP11-110G21.1 | 47.45 |
| chr8: 52782640-52782790 | RP11-110G21.2 | 47.45 |
| chr4: 99404480-99404630 | TSPAN5 | 51.02 |
| chr4: 99404480-99404630 | RAP1GDS1 | 51.02 |
| chr1: 39620280-39620430 | MACF1 | 52.65 |
| chr17: 62052060-62052210 | CD79B | 54.57 |
| chr3: 43673705-43673855 | ABHD5 | 59.12 |
| chr3: 43673705-43673855 | ANO10 | 59.12 |
| chr9: 33765500-33765650 | PRSS3 | 62.34 |
| chr9: 33765500-33765650 | PTENP1 | 62.34 |