SOM cluster: 1441
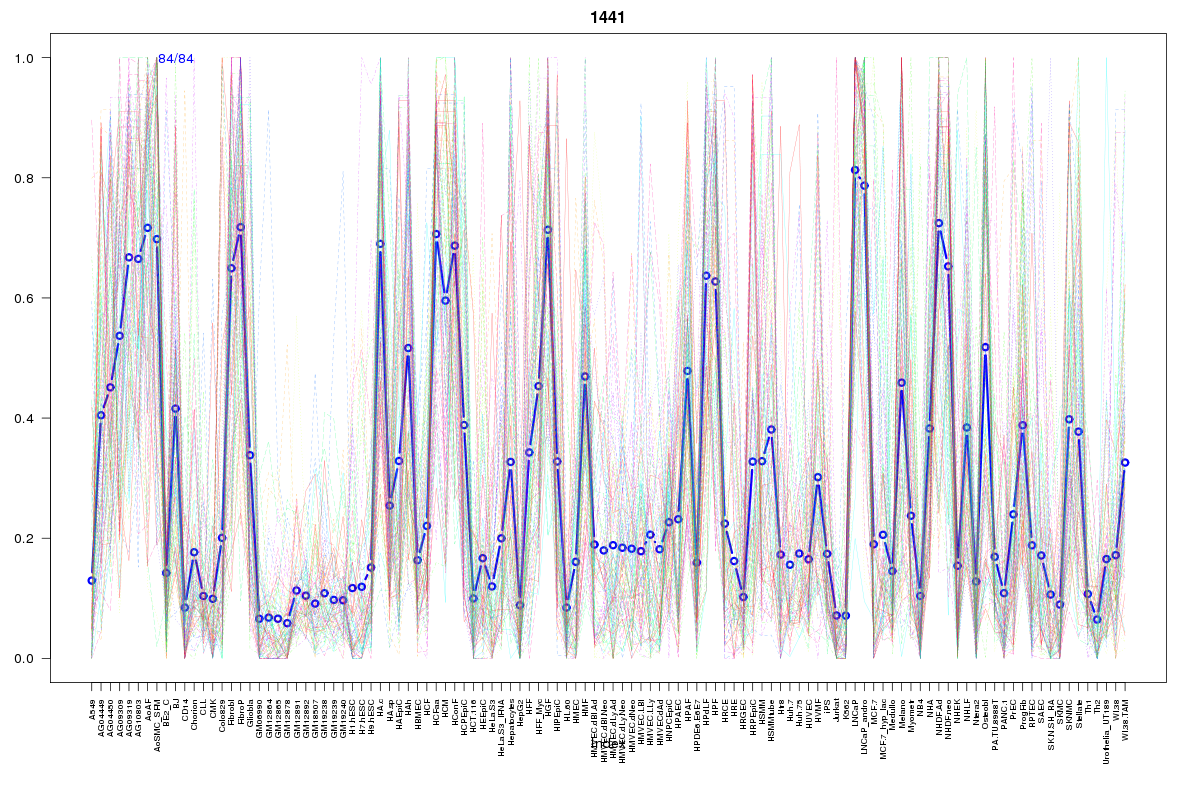
Cluster Hypersensitivity Profile

Genomic Location Trend
These plots show the distribution of the DHS sites surrounding the Transcript Start Site of the nearest gene.
Stats
Number of sites: 84Promoter: 2%
CpG-Island: 2%
Conserved: 47%
Enriched Motifs & Matches
Match Detail: [Jaspar]
|
| ||
|---|---|---|
| Sites: 55/84 | e-val: 2.2e-21 | ||
| Factor | e-val(match) | DB |
| TLX1::NFIC | 0.0000081746 | JASPAR |
| NFIC | 0.0022858 | JASPAR |
| PPARG::RXRA | 0.0042462 | JASPAR |
| EWSR1-FLI1 | 0.0072419 | JASPAR |
| HNF4A | 0.014749 | JASPAR |
BED file downloads
Top 10 Example Regions
| Location | Gene Link | Dist. |
|---|---|---|
| chr13: 99135500-99135650 | FARP1 | 46.79 |
| chr13: 99135500-99135650 | STK24 | 46.79 |
| chr8: 11666480-11666630 | CTSB | 55.74 |
| chr3: 138617300-138617450 | PIK3CB | 56.54 |
| chr9: 132952220-132952370 | HMCN2 | 58.3 |
| chr16: 58056660-58056810 | C16orf80 | 67.66 |
| chr6: 160462760-160462910 | IGF2R | 70.58 |
| chr9: 131926600-131926750 | CRAT | 73.85 |
| chr6: 36703500-36703650 | LAP3P2 | 74.67 |
| chr6: 36703500-36703650 | CDKN1A | 74.67 |