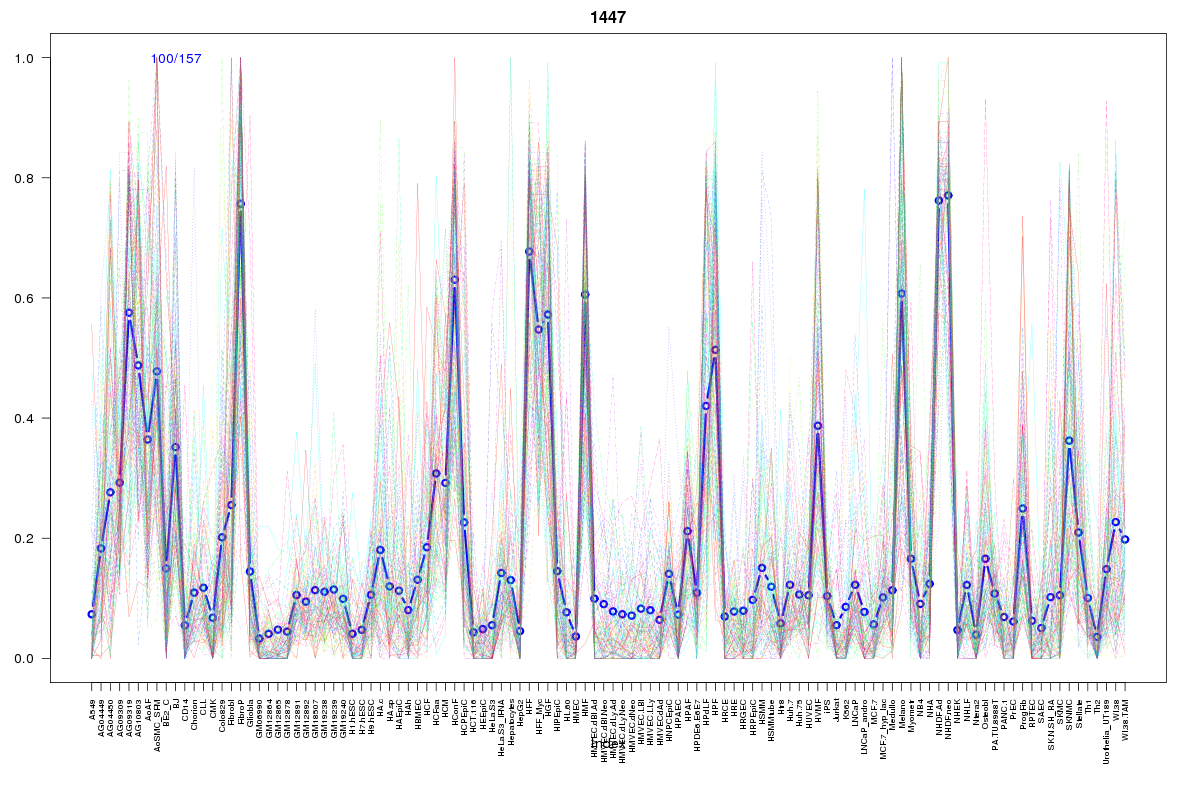
SOM cluster: 1447
Cluster Hypersensitivity Profile

Genomic Location Trend
These plots show the distribution of the DHS sites surrounding the Transcript Start Site of the nearest gene.
Stats
Number of sites: 157Promoter: 2%
CpG-Island: 0%
Conserved: 49%
Enriched Motifs & Matches
Match Detail: [Jaspar]
|
| ||
|---|---|---|
| Sites: 46/100 | e-val: 0.000000000000006 | ||
| Factor | e-val(match) | DB |
| TAL1::TCF3 | 0.000000237 | JASPAR |
| ELK4 | 0.00066218 | JASPAR |
| Hand1::Tcfe2a | 0.0025417 | JASPAR |
| T | 0.0041791 | JASPAR |
| GABPA | 0.0055239 | JASPAR |
BED file downloads
Top 10 Example Regions
| Location | Gene Link | Dist. |
|---|---|---|
| chr11: 35627360-35627510 | PAMR1 | 50.57 |
| chr2: 47100520-47100670 | LINC01119 | 64.43 |
| chr21: 47398080-47398230 | COL6A1 | 65.85 |
| chr21: 47398080-47398230 | PCBP3 | 65.85 |
| chr12: 13350800-13350950 | EMP1 | 68.64 |
| chr11: 71750180-71750330 | RNF121 | 69.08 |
| chr1: 170647480-170647630 | PRRX1 | 71.88 |
| chr5: 55371220-55371370 | CTD-2031P19.3 | 75.33 |
| chr5: 55371220-55371370 | ANKRD55 | 75.33 |
| chr6: 1364520-1364670 | FOXF2 | 76.44 |