SOM cluster: 1481
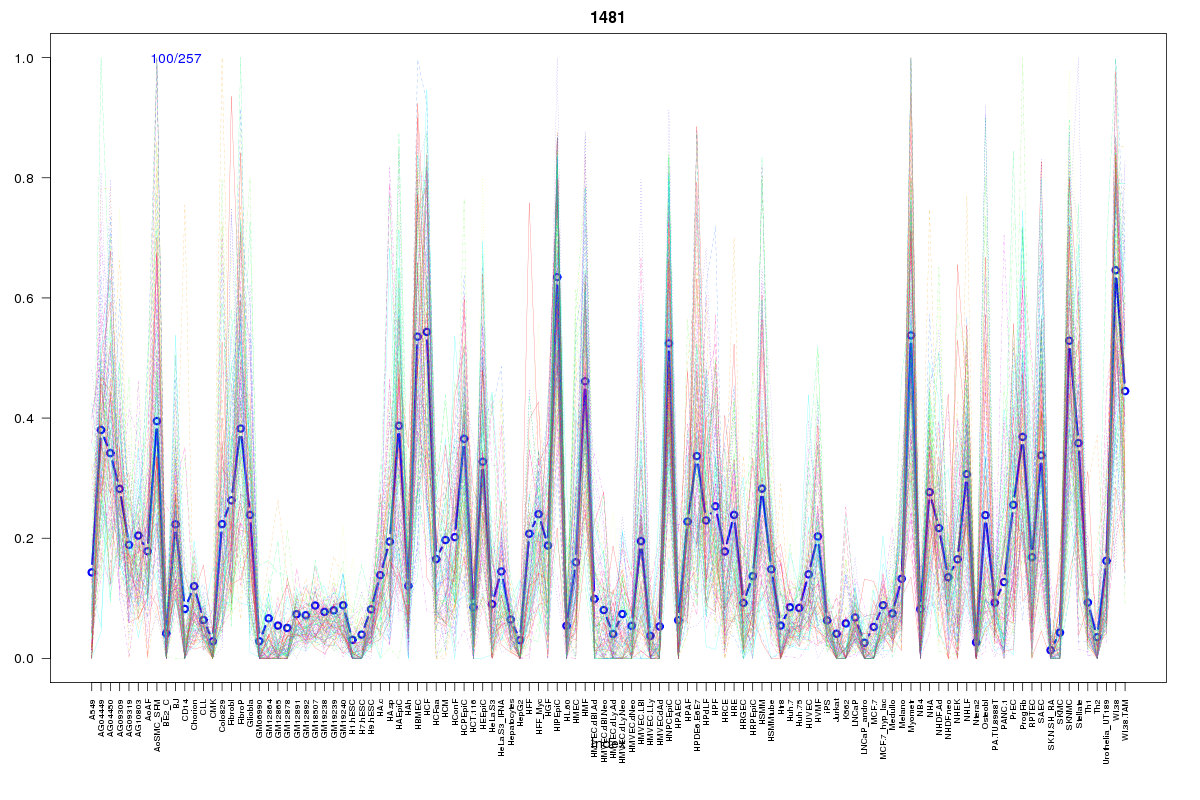
Cluster Hypersensitivity Profile

Genomic Location Trend
These plots show the distribution of the DHS sites surrounding the Transcript Start Site of the nearest gene.
Stats
Number of sites: 257Promoter: 1%
CpG-Island: 0%
Conserved: 27%
Enriched Motifs & Matches
Match Detail: [Jaspar]
|
| ||
|---|---|---|
| Sites: 37/100 | e-val: 0.00000036 | ||
| Factor | e-val(match) | DB |
| AP1 | 0.0000000011453 | JASPAR |
| NFE2L2 | 0.0000000011636 | JASPAR |
| NFE2L1::MafG | 0.00015007 | JASPAR |
| Pax2 | 0.005133 | JASPAR |
| PBX1 | 0.014446 | JASPAR |
BED file downloads
Top 10 Example Regions
| Location | Gene Link | Dist. |
|---|---|---|
| chr5: 130578340-130578490 | HINT1 | 41.13 |
| chr11: 35671660-35671810 | FJX1 | 44.12 |
| chr8: 95920000-95920150 | RP11-347C18.3 | 47.61 |
| chr8: 95920000-95920150 | NDUFAF6 | 47.61 |
| chr5: 109159440-109159590 | MAN2A1 | 48.63 |
| chr7: 55120560-55120710 | EGFR | 51.77 |
| chr6: 31043420-31043570 | POU5F1 | 52.98 |
| chr11: 57057920-57058070 | PRG2 | 57.4 |
| chr11: 57057920-57058070 | TNKS1BP1 | 57.4 |
| chr11: 57057920-57058070 | SSRP1 | 57.4 |