SOM cluster: 1490
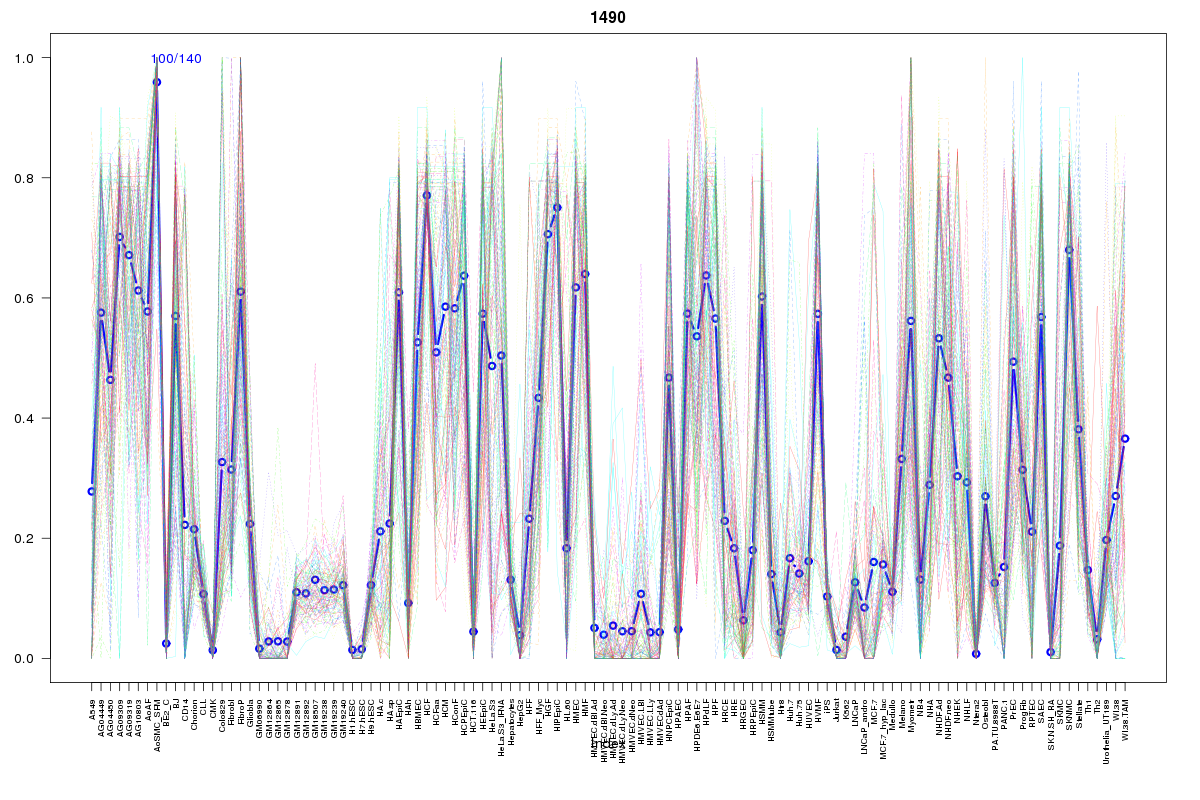
Cluster Hypersensitivity Profile

Genomic Location Trend
These plots show the distribution of the DHS sites surrounding the Transcript Start Site of the nearest gene.
Stats
Number of sites: 140Promoter: 2%
CpG-Island: 0%
Conserved: 42%
Enriched Motifs & Matches
Match Detail: [Jaspar]
|
| ||
|---|---|---|
| Sites: 25/100 | e-val: 0.66 | ||
| Factor | e-val(match) | DB |
| Lhx3 | 0.000005792 | JASPAR |
| NFE2L2 | 0.000082154 | JASPAR |
| AP1 | 0.00013 | JASPAR |
| HNF1A | 0.00021702 | JASPAR |
| NFE2L1::MafG | 0.00056242 | JASPAR |
BED file downloads
Top 10 Example Regions
| Location | Gene Link | Dist. |
|---|---|---|
| chr1: 92018780-92018930 | HSP90B3P | 3.85 |
| chr12: 27780180-27780330 | RP11-1060J15.5 | 49.12 |
| chr17: 13324340-13324490 | HS3ST3A1 | 50.2 |
| chr6: 20907320-20907470 | CDKAL1 | 56.84 |
| chr6: 117763160-117763310 | DCBLD1 | 58.37 |
| chr4: 74587300-74587450 | RN7SL492P | 59.19 |
| chr17: 38529680-38529830 | TOP2A | 63.21 |
| chr17: 38529680-38529830 | CDC6 | 63.21 |
| chr4: 54489160-54489310 | FIP1L1 | 63.38 |
| chr17: 6830740-6830890 | BCL6B | 64.68 |