SOM cluster: 1498
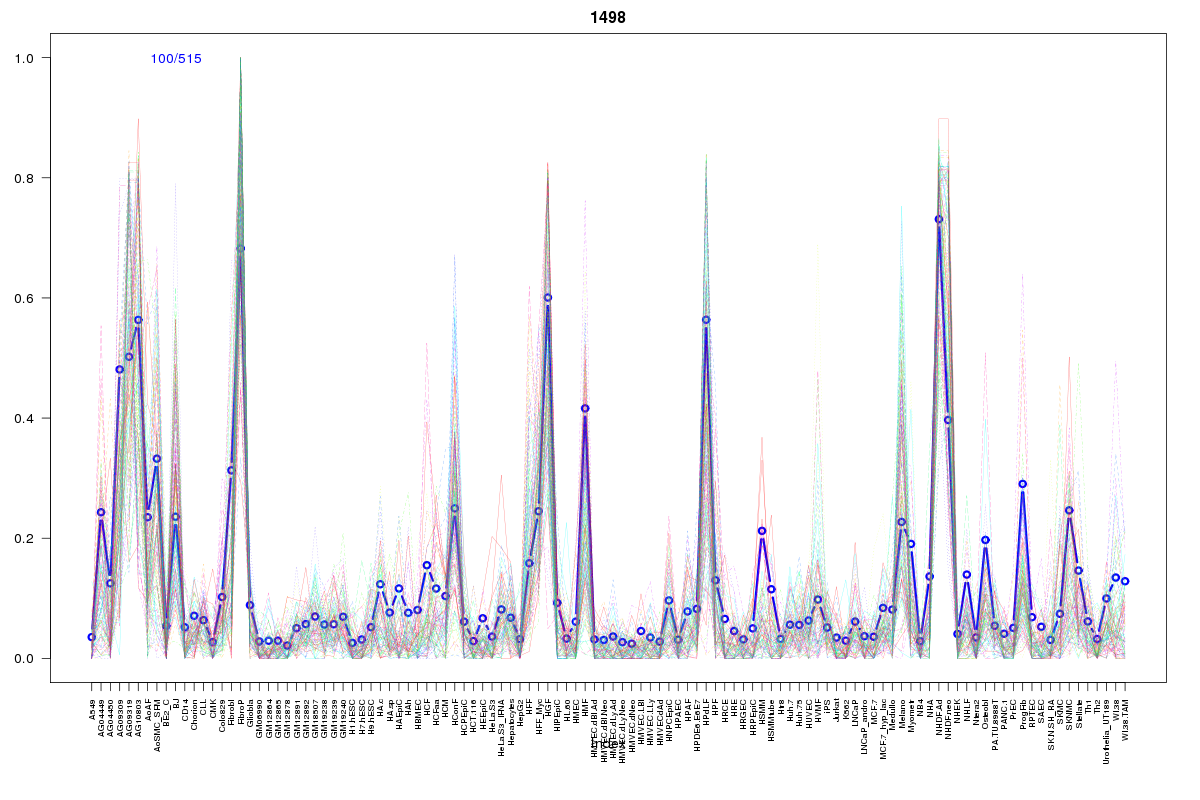
Cluster Hypersensitivity Profile

Genomic Location Trend
These plots show the distribution of the DHS sites surrounding the Transcript Start Site of the nearest gene.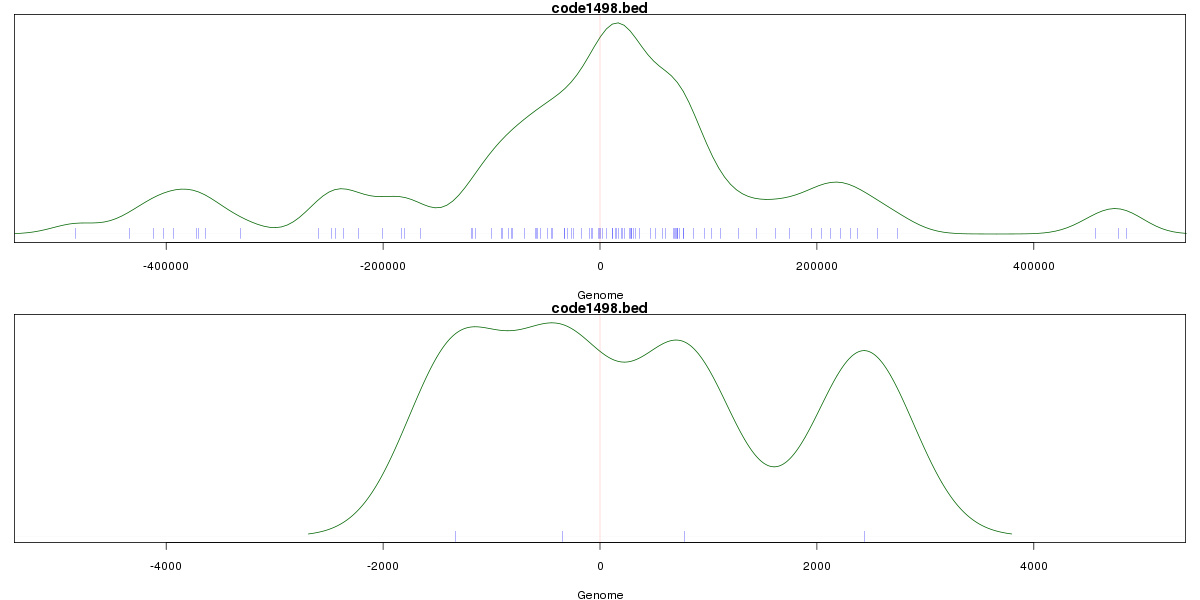
Stats
Number of sites: 515Promoter: 2%
CpG-Island: 0%
Conserved: 46%
Enriched Motifs & Matches
Match Detail: [Jaspar]
|
| ||
|---|---|---|
| Sites: 37/100 | e-val: 0.000000000000026 | ||
| Factor | e-val(match) | DB |
| TAL1::TCF3 | 0.000017243 | JASPAR |
| Pdx1 | 0.00036826 | JASPAR |
| HNF1A | 0.00039216 | JASPAR |
| Prrx2 | 0.00083665 | JASPAR |
| Tcfcp2l1 | 0.0012309 | JASPAR |
BED file downloads
Top 10 Example Regions
| Location | Gene Link | Dist. |
|---|---|---|
| chr8: 121369820-121369970 | COL14A1 | 30.97 |
| chr12: 104254960-104255110 | C12orf73 | 45.23 |
| chr8: 120613625-120613775 | RP11-99I9.2 | 49.03 |
| chr8: 120613625-120613775 | ENPP2 | 49.03 |
| chr13: 44892000-44892150 | SERP2 | 52.98 |
| chr16: 4131880-4132030 | ADCY9 | 56.84 |
| chr12: 11850760-11850910 | ETV6 | 61.88 |
| chr3: 112876580-112876730 | RP11-572M11.1 | 61.92 |
| chr3: 112876580-112876730 | BOC | 61.92 |
| chr8: 69173600-69173750 | C8orf34 | 63.11 |