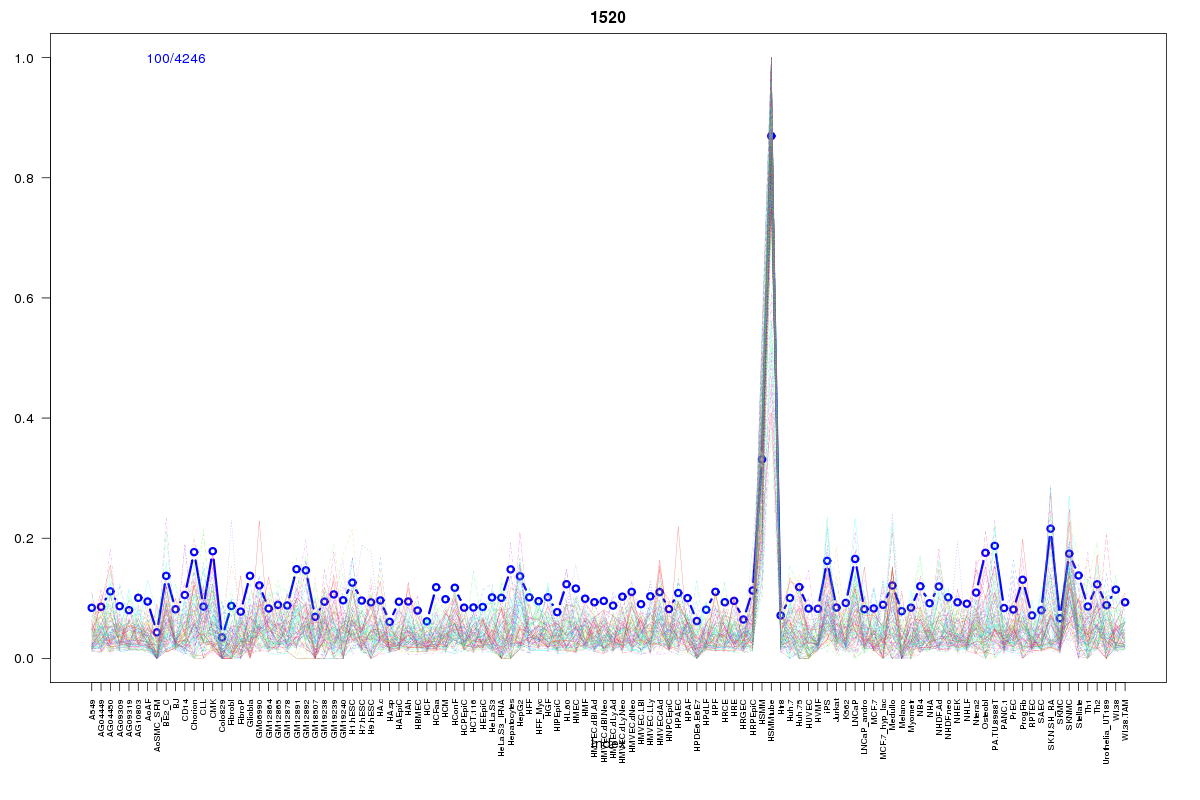
SOM cluster: 1520
Cluster Hypersensitivity Profile

Genomic Location Trend
These plots show the distribution of the DHS sites surrounding the Transcript Start Site of the nearest gene.
Stats
Number of sites: 4246Promoter: 5%
CpG-Island: 1%
Conserved: 41%
Enriched Motifs & Matches
Match Detail: [Jaspar]
|
| ||
|---|---|---|
| Sites: 74/100 | e-val: 0 | ||
| Factor | e-val(match) | DB |
| Myf | 0.000000010518 | JASPAR |
| NHLH1 | 0.0000059682 | JASPAR |
| REST | 0.00063398 | JASPAR |
| Myb | 0.00088301 | JASPAR |
| Tal1::Gata1 | 0.0014462 | JASPAR |
|
| ||
| Sites: 77/100 | e-val: 3.3e-30 | ||
| Factor | e-val(match) | DB |
| SP1 | 0.0000013804 | JASPAR |
| INSM1 | 0.00017232 | JASPAR |
| RREB1 | 0.0014638 | JASPAR |
| PPARG::RXRA | 0.0032835 | JASPAR |
| RXR::RAR_DR5 | 0.0048622 | JASPAR |
|
| ||
| Sites: 25/100 | e-val: 0.029 | ||
| Factor | e-val(match) | DB |
| Myf | 0.00000000021594 | JASPAR |
| NHLH1 | 0.00000062429 | JASPAR |
| TAL1::TCF3 | 0.0022244 | JASPAR |
| CTCF | 0.0027494 | JASPAR |
| Myb | 0.0079843 | JASPAR |
BED file downloads
Top 10 Example Regions
| Location | Gene Link | Dist. |
|---|---|---|
| chr9: 131467700-131467850 | ZDHHC12 | 35.41 |
| chr22: 19716520-19716670 | GNB1L | 40.73 |
| chr5: 179604605-179604755 | RASGEF1C | 41.81 |
| chr9: 138923680-138923830 | UBAC1 | 43.3 |
| chr8: 144488385-144488535 | RP11-909N17.3 | 44.73 |
| chr19: 49492920-49493070 | BAX | 45.85 |
| chr22: 36829080-36829230 | Y_RNA | 45.88 |
| chr8: 144484820-144484970 | ZC3H3 | 45.91 |
| chr1: 203005500-203005650 | PPFIA4 | 46.51 |
| chr13: 32596580-32596730 | EEF1DP3 | 47.47 |