SOM cluster: 1562
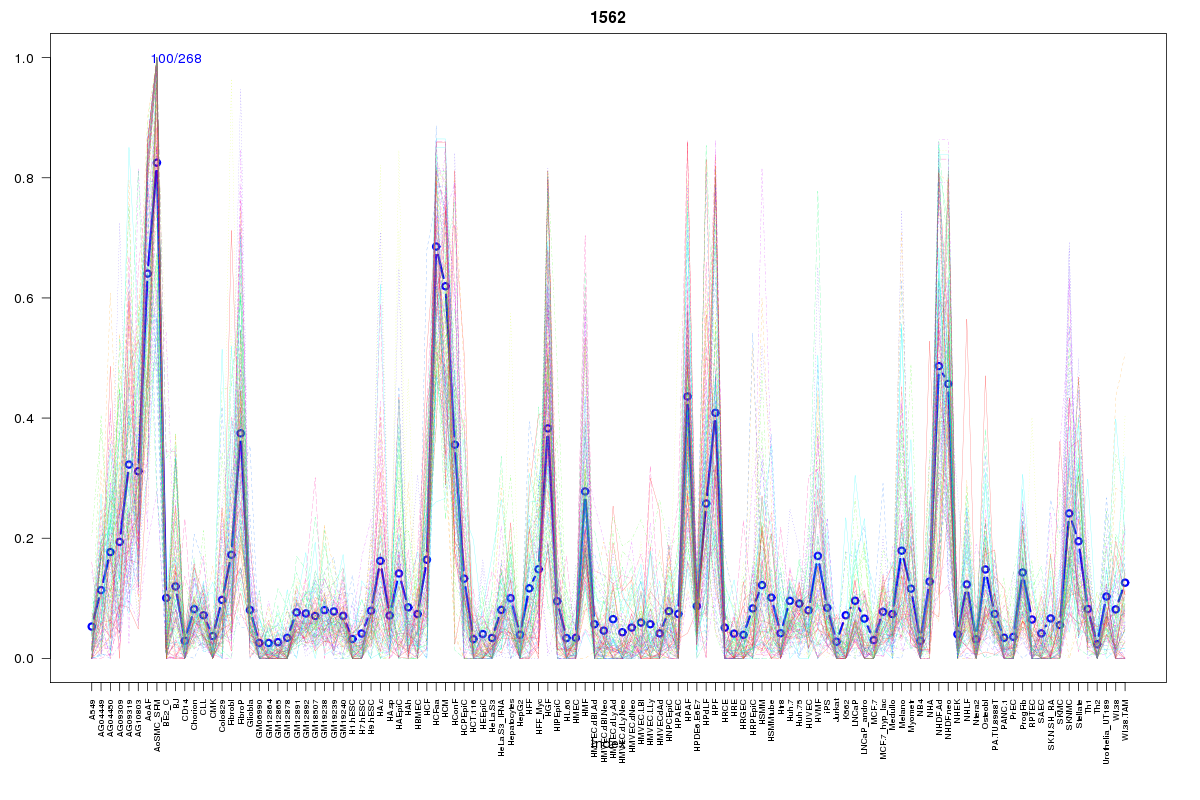
Cluster Hypersensitivity Profile

Genomic Location Trend
These plots show the distribution of the DHS sites surrounding the Transcript Start Site of the nearest gene.
Stats
Number of sites: 268Promoter: 1%
CpG-Island: 0%
Conserved: 48%
Enriched Motifs & Matches
Match Detail: [Jaspar]
|
| ||
|---|---|---|
| Sites: 38/100 | e-val: 0.0000000093 | ||
| Factor | e-val(match) | DB |
| CEBPA | 0.000081149 | JASPAR |
| NFATC2 | 0.00021405 | JASPAR |
| Pou5f1 | 0.0014644 | JASPAR |
| FOXO3 | 0.0017685 | JASPAR |
| NFIC | 0.0060739 | JASPAR |
|
| ||
| Sites: 21/100 | e-val: 1.1 | ||
| Factor | e-val(match) | DB |
| FEV | 0.00022246 | JASPAR |
| Stat3 | 0.00058892 | JASPAR |
| HNF1B | 0.010187 | JASPAR |
| HOXA5 | 0.013444 | JASPAR |
| Foxd3 | 0.021126 | JASPAR |
BED file downloads
Top 10 Example Regions
| Location | Gene Link | Dist. |
|---|---|---|
| chr7: 65610580-65610730 | TPST1 | 39.19 |
| chr17: 6658620-6658770 | XAF1 | 40.57 |
| chr4: 186771040-186771190 | SORBS2 | 50.07 |
| chr4: 88461700-88461850 | SPARCL1 | 54.64 |
| chr8: 49463120-49463270 | RP11-567J20.2 | 57.06 |
| chr2: 152171960-152172110 | TNFAIP6 | 57.74 |
| chr2: 152171960-152172110 | RN7SL124P | 57.74 |
| chr12: 117155340-117155490 | RP11-497G19.1 | 58.35 |
| chr1: 78300820-78300970 | NEXN | 59.05 |
| chr1: 201248540-201248690 | PKP1 | 59.81 |