SOM cluster: 1569
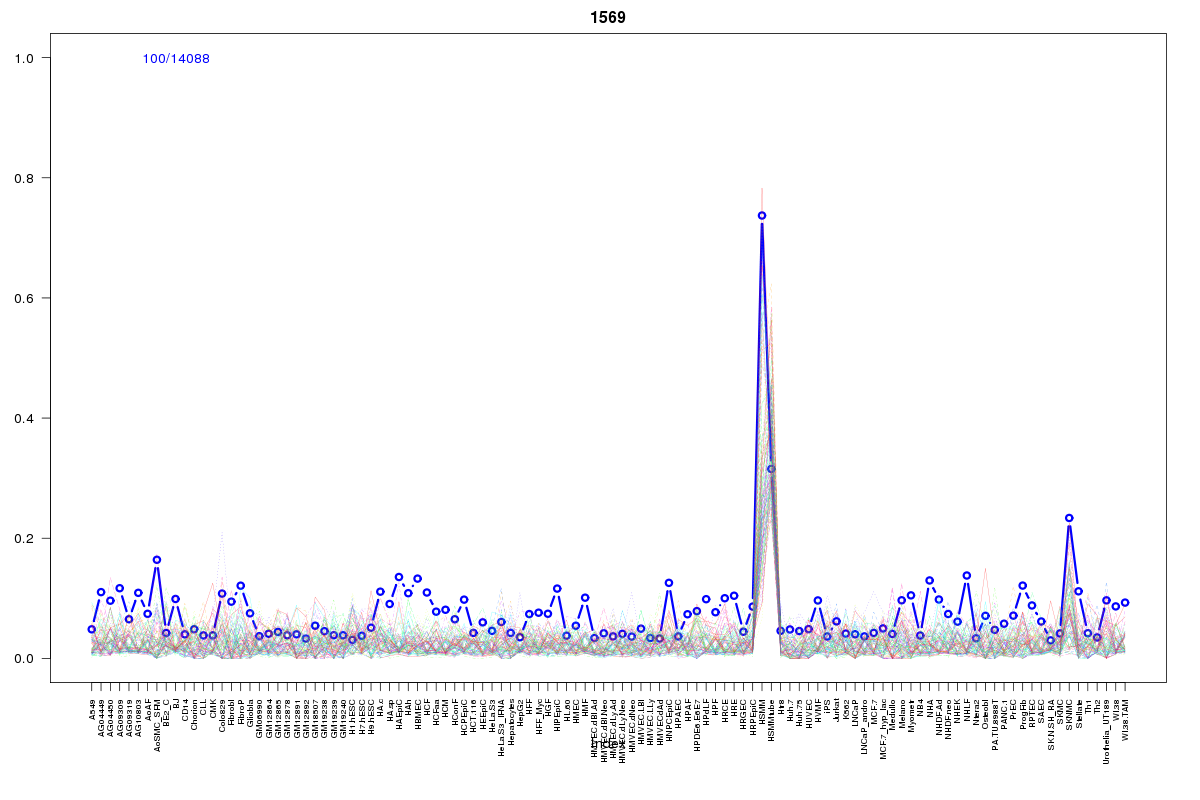
Cluster Hypersensitivity Profile

Genomic Location Trend
These plots show the distribution of the DHS sites surrounding the Transcript Start Site of the nearest gene.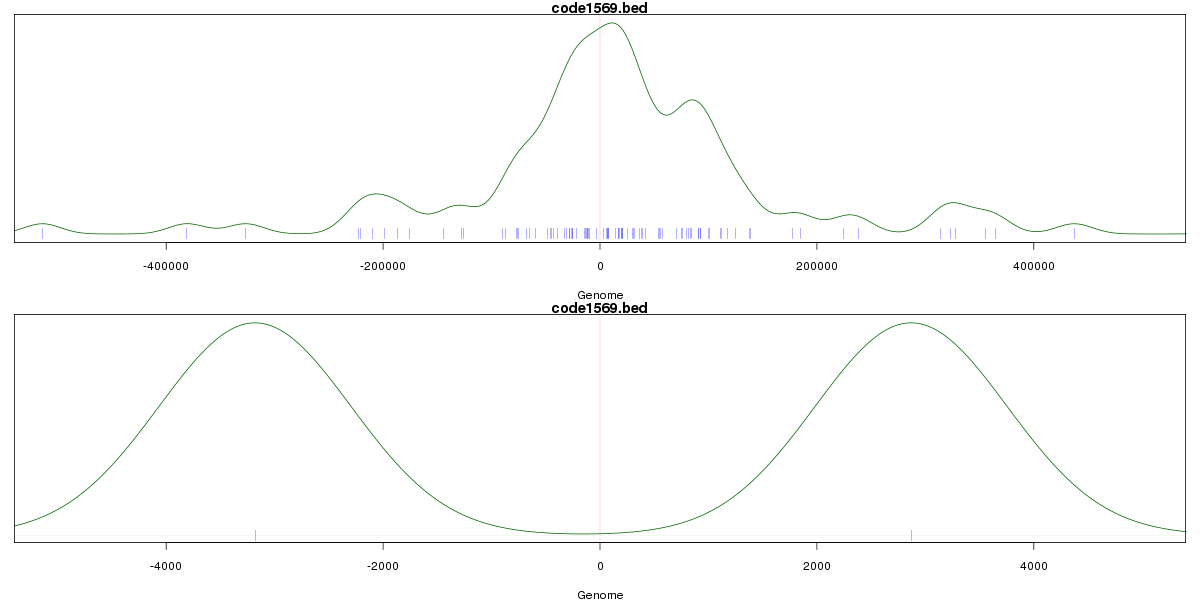
Stats
Number of sites: 14088Promoter: 0%
CpG-Island: 0%
Conserved: 24%
Enriched Motifs & Matches
Match Detail: [Jaspar]
|
| ||
|---|---|---|
| Sites: 58/100 | e-val: 1.3e-38 | ||
| Factor | e-val(match) | DB |
| Myf | 0.000000082759 | JASPAR |
| NHLH1 | 0.000026383 | JASPAR |
| TAL1::TCF3 | 0.000046178 | JASPAR |
| Myb | 0.000087612 | JASPAR |
| REST | 0.0012886 | JASPAR |
BED file downloads
Top 10 Example Regions
| Location | Gene Link | Dist. |
|---|---|---|
| chr12: 10777380-10777530 | STYK1 | 30.83 |
| chr17: 76433085-76433235 | DNAH17 | 30.91 |
| chr13: 99093360-99093510 | FARP1-AS1 | 31.08 |
| chr6: 118943360-118943510 | PLN | 37.49 |
| chr8: 99965740-99965890 | RN7SKP85 | 39.25 |
| chr8: 99965740-99965890 | RP11-44N12.2 | 39.25 |
| chr11: 61018980-61019130 | DAK | 40.01 |
| chr8: 53552240-53552390 | FAM150A | 42.09 |
| chr4: 87840125-87840275 | RP11-397E7.2 | 42.4 |
| chr12: 104173280-104173430 | NT5DC3 | 42.72 |