SOM cluster: 1574
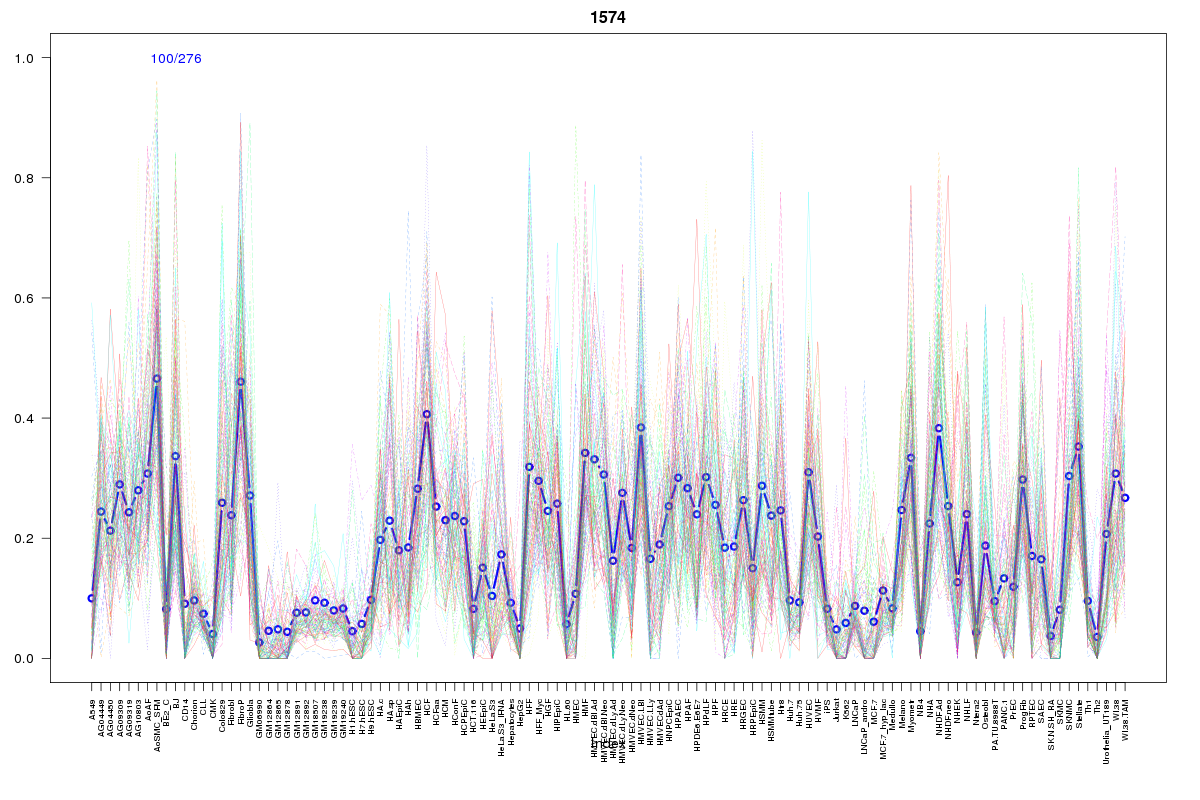
Cluster Hypersensitivity Profile

Genomic Location Trend
These plots show the distribution of the DHS sites surrounding the Transcript Start Site of the nearest gene.
Stats
Number of sites: 276Promoter: 5%
CpG-Island: 0%
Conserved: 34%
Enriched Motifs & Matches
Match Detail: [Jaspar]
|
| ||
|---|---|---|
| Sites: 44/100 | e-val: 0.000000000000003 | ||
| Factor | e-val(match) | DB |
| AP1 | 0.00000000060011 | JASPAR |
| NFE2L2 | 0.0000000021982 | JASPAR |
| NFE2L1::MafG | 0.00014747 | JASPAR |
| PBX1 | 0.0034803 | JASPAR |
| Pax6 | 0.012008 | JASPAR |
|
| ||
| Sites: 23/100 | e-val: 0.0000079 | ||
| Factor | e-val(match) | DB |
| Foxd3 | 0.00032427 | JASPAR |
| Foxq1 | 0.0015954 | JASPAR |
| Pax4 | 0.0063049 | JASPAR |
| Lhx3 | 0.0075984 | JASPAR |
| MEF2A | 0.010561 | JASPAR |
BED file downloads
Top 10 Example Regions
| Location | Gene Link | Dist. |
|---|---|---|
| chr1: 92330140-92330290 | BRDT | 12 |
| chr10: 82222500-82222650 | FAM213A | 26.09 |
| chrX: 70761660-70761810 | INGX | 38.42 |
| chr8: 121637725-121637875 | CTC-820M8.1 | 38.47 |
| chr5: 132040680-132040830 | SEPT8 | 41.69 |
| chr17: 72985025-72985175 | CDR2L | 43.33 |
| chr17: 72985025-72985175 | RN7SL573P | 43.33 |
| chr3: 42103040-42103190 | RP11-626A1.1 | 46.96 |
| chr15: 61343685-61343835 | RORA | 51.73 |
| chr19: 38768600-38768750 | SPINT2 | 52.06 |