SOM cluster: 1582
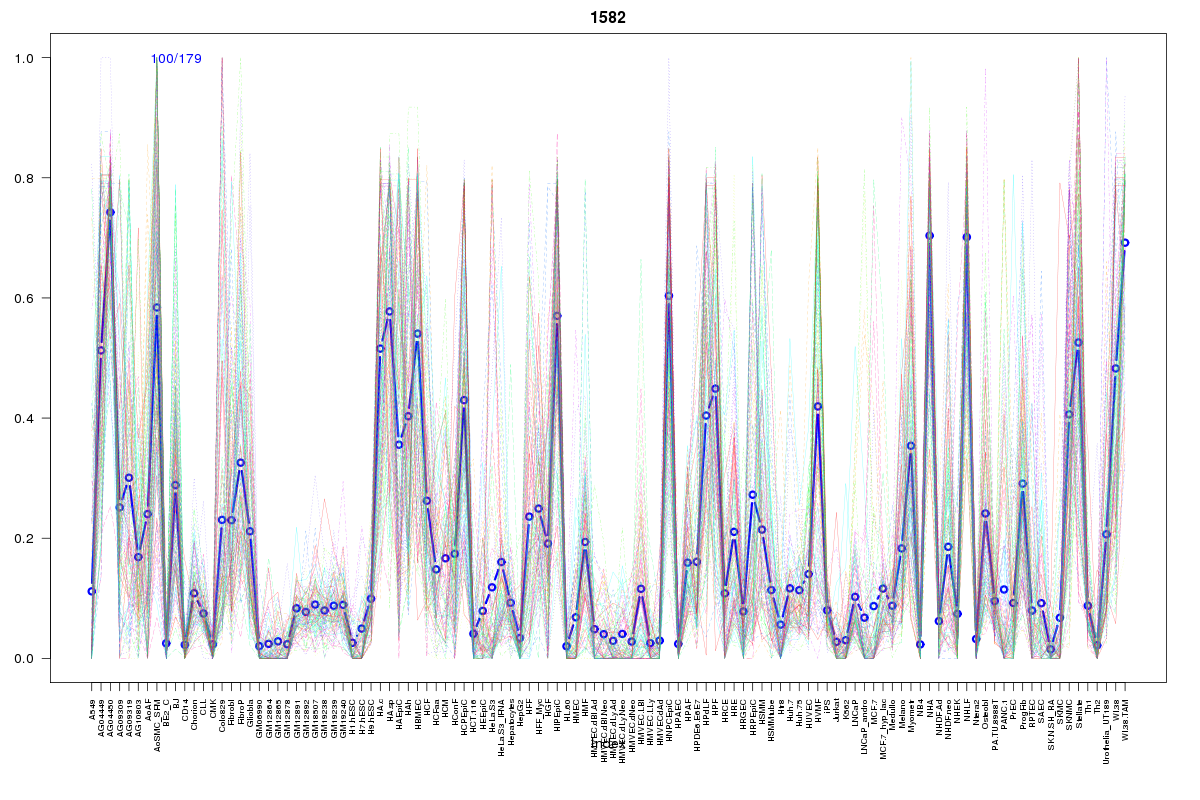
Cluster Hypersensitivity Profile

Genomic Location Trend
These plots show the distribution of the DHS sites surrounding the Transcript Start Site of the nearest gene.
Stats
Number of sites: 179Promoter: 1%
CpG-Island: 0%
Conserved: 36%
Enriched Motifs & Matches
Match Detail: [Jaspar]
|
| ||
|---|---|---|
| Sites: 29/100 | e-val: 0.000000019 | ||
| Factor | e-val(match) | DB |
| FOXI1 | 0.00000033057 | JASPAR |
| FOXA1 | 0.0000026783 | JASPAR |
| Foxq1 | 0.0000031692 | JASPAR |
| Foxd3 | 0.0000050439 | JASPAR |
| Foxa2 | 0.0000080448 | JASPAR |
|
| ||
| Sites: 14/100 | e-val: 0.46 | ||
| Factor | e-val(match) | DB |
| Pou5f1 | 0.00000019084 | JASPAR |
| Sox2 | 0.00000021541 | JASPAR |
| Foxd3 | 0.00024139 | JASPAR |
| SOX10 | 0.0011253 | JASPAR |
| FOXI1 | 0.0012376 | JASPAR |
BED file downloads
Top 10 Example Regions
| Location | Gene Link | Dist. |
|---|---|---|
| chr5: 120114740-120114890 | PRR16 | 55.66 |
| chr2: 196385765-196385915 | SLC39A10 | 62.86 |
| chr1: 40311900-40312050 | RP1-118J21.5 | 63.24 |
| chr16: 86500420-86500570 | FOXF1 | 65.41 |
| chr5: 38765580-38765730 | RP11-122C5.1 | 66.45 |
| chr1: 43815740-43815890 | MED8 | 66.49 |
| chr4: 74725400-74725550 | CXCL6 | 67.96 |
| chr15: 71565380-71565530 | THSD4 | 68.71 |
| chr5: 92935260-92935410 | NR2F1 | 69.05 |
| chr5: 92935260-92935410 | NR2F1-AS1 | 69.05 |