SOM cluster: 1591
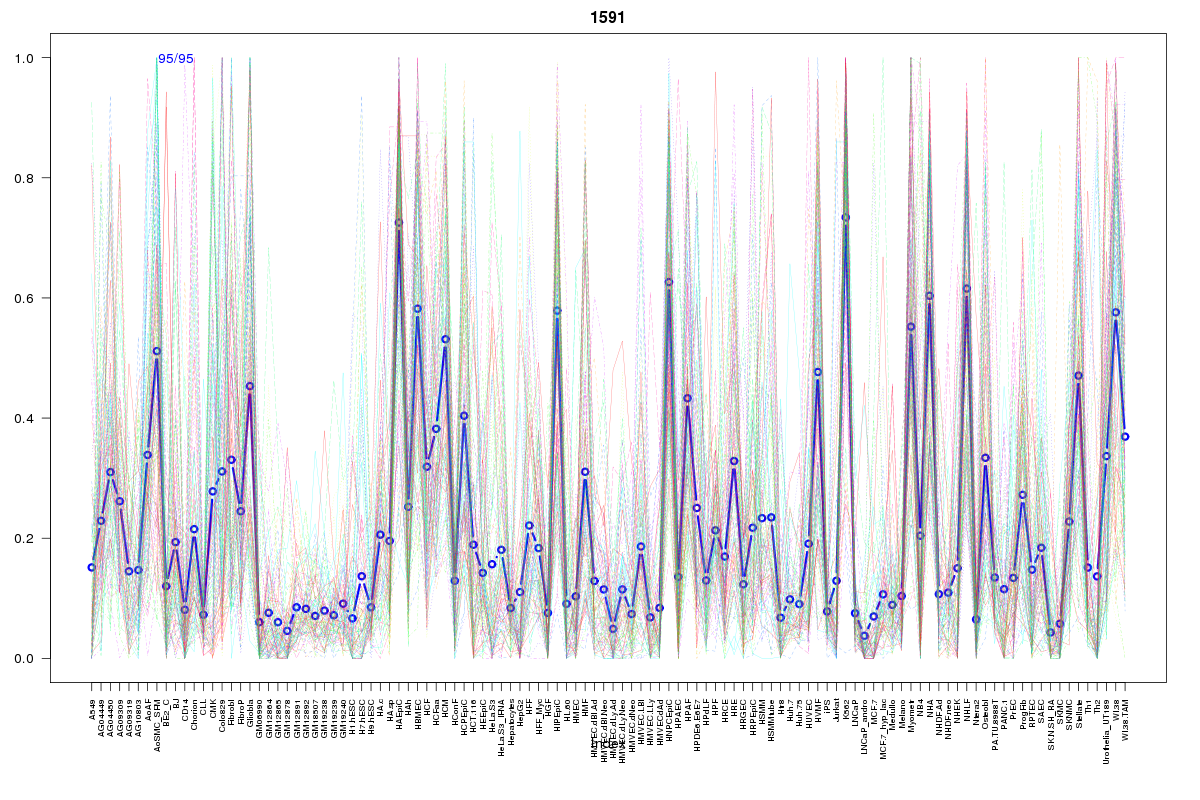
Cluster Hypersensitivity Profile

Genomic Location Trend
These plots show the distribution of the DHS sites surrounding the Transcript Start Site of the nearest gene.
Stats
Number of sites: 95Promoter: 7%
CpG-Island: 0%
Conserved: 28%
Enriched Motifs & Matches
Match Detail: [Jaspar]
|
| ||
|---|---|---|
| Sites: 25/95 | e-val: 0.000026 | ||
| Factor | e-val(match) | DB |
| NFE2L2 | 0.00000000010002 | JASPAR |
| AP1 | 0.0000000013952 | JASPAR |
| Mafb | 0.0067352 | JASPAR |
| PPARG | 0.0131 | JASPAR |
| NFE2L1::MafG | 0.018779 | JASPAR |
BED file downloads
Top 10 Example Regions
| Location | Gene Link | Dist. |
|---|---|---|
| chr13: 108536220-108536370 | FAM155A | 41.13 |
| chr4: 174138900-174139050 | GALNT7 | 49.47 |
| chr4: 174138900-174139050 | RN7SL253P | 49.47 |
| chr2: 109187000-109187150 | LIMS1 | 53.25 |
| chr2: 109187000-109187150 | GCC2 | 53.25 |
| chr3: 13588400-13588550 | FBLN2 | 57.73 |
| chr1: 41799140-41799290 | RP11-399E6.1 | 65.24 |
| chr16: 81353320-81353470 | BCMO1 | 69.4 |
| chr3: 167752060-167752210 | GOLIM4 | 74.28 |
| chr11: 12280140-12280290 | MICAL2 | 75.38 |